I discovered through velovision.co.uk that the first issue of the "Electric Bike" magazine is out and ready for viewing online. The publication goes a bit indepth into e-bikes for starters, what they comprise of, the models available in the market and supplier locations. Enjoy the read.
Monday, August 30, 2010
6 Electric Bike Issue One
Sunday, August 29, 2010
7 Tour of the Highlands : Part 2
140 Miles
8000 Ft Climbing
10 hours saddle time

In two weeks time is yet another edition of one of the toughest rides in the country - the "Highlander Death Before Dismount" Double Metric. 125 miles long in the beautiful Finger Lakes region, with over 10,000 feet of climbing in 16 major climbs, it will surely challenge any rider.
Preparation and judgment are keys to riding an extreme event like this. My own preparation has so far been limited to perhaps half the roads in DB4D, on the western side of the map. Following is a look at some of the roads I had managed to survey yesterday. Let this be a sequel to my exploration last year of the same area.
It was a difficult day on the bike - all alone, with temperatures in its 90's. But the sunlit landscapes I passed on the bike managed to neutralize the heat. Overall, it turned out to be an extremely pleasant experience for both sight and smell and sounds. One of the highlights of the day was that I managed to talk to a young Amish country guy, whom I asked for directions after I overshot one of the roads I was required to take by 5 miles. He had the most pleasant smile on his face as he stacked stock for his animals into a tractor. He also carried this peculiar accent, something almost out of this world. It was like he came straight out of these classic movies you see...
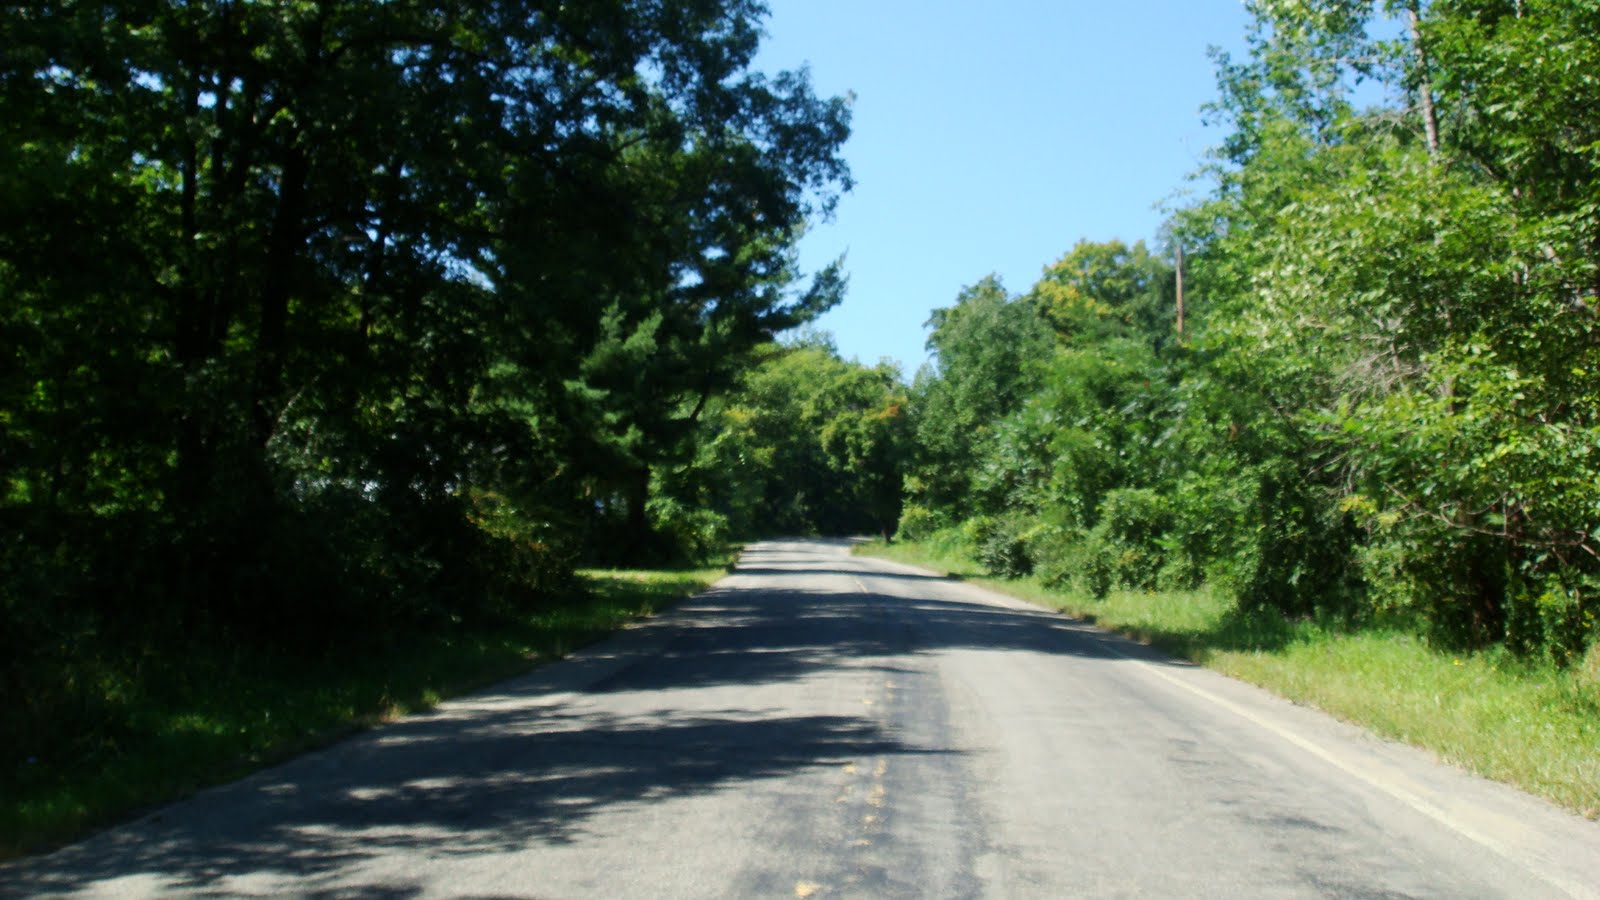
Enjoy these pics, all of them taken from the bike - an artform I call ciclofotografics! Do come ride in the Finger Lakes area! Its a bit different, I can tell you that much.

Route 96

High Street

Town of Victor, NY

Route 444 to village of Bloomsfield


Route 64 to Bristol Springs

Montanye Road

Descent on Deuel Road to western side of Lake Canandaigua, fourth largest of the Finger Lakes


Seneca Point Road to Bopple Hill


Bopple Hill Road - 1 mile at 11% average gradient (will be chip-sealed on Monday 30th August)

The familiar cemetery greets you at the peak

View to the eastern side of the Lake
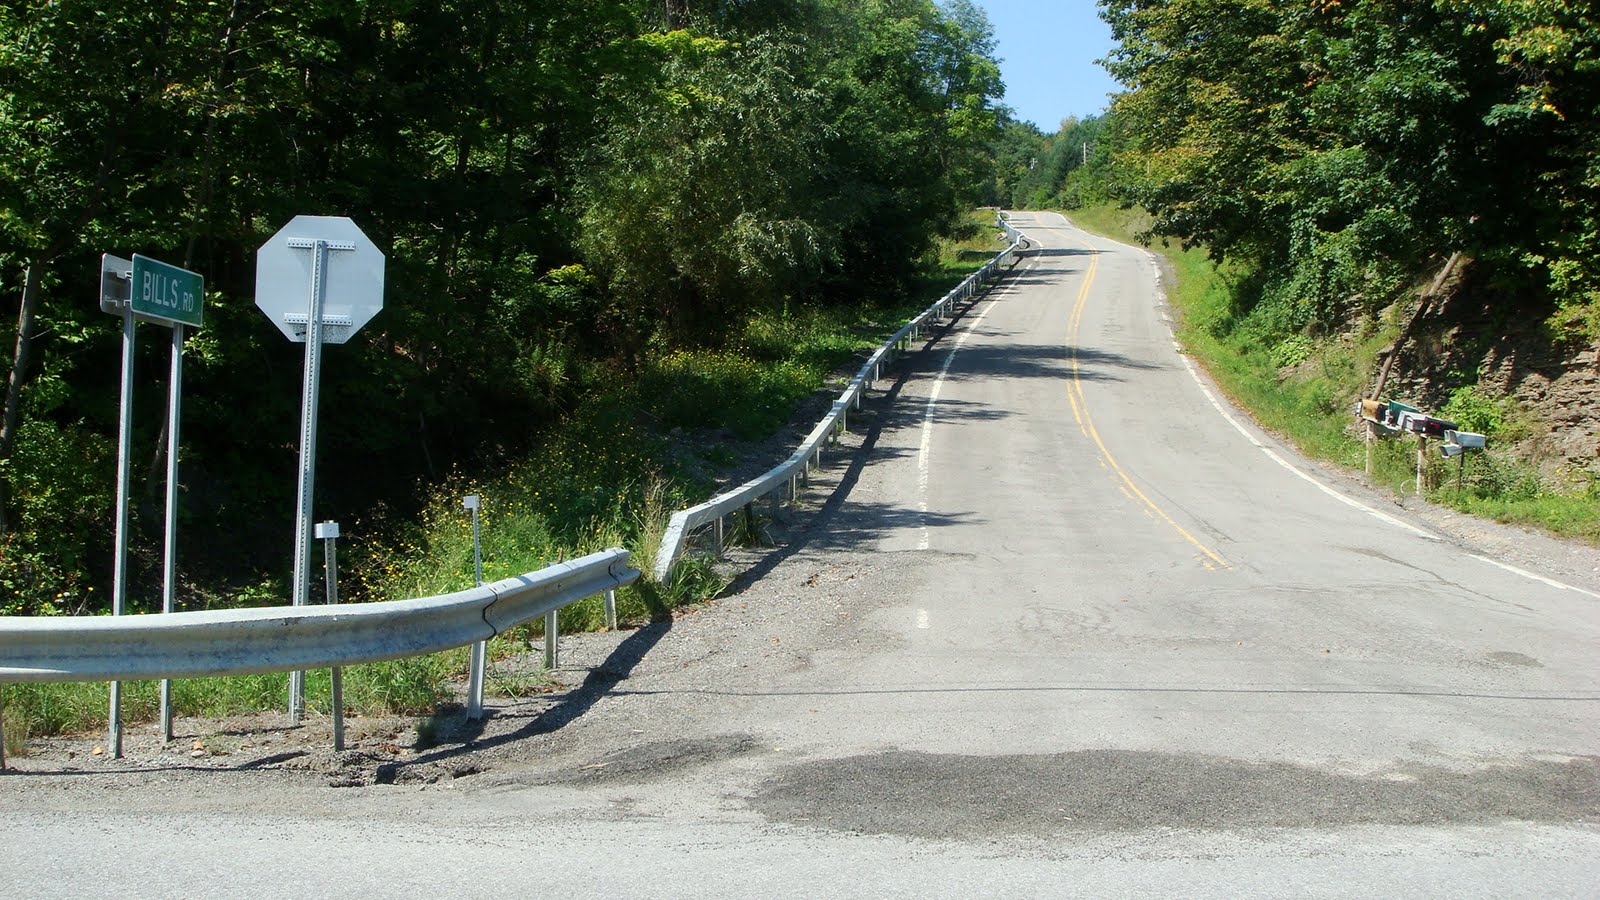
Bills Road to Stid Hill , 1 mile at 13.4% grade

Summit of Stid Hill in Ontario NY at 2100 feet
West Gannett Hill Road - 1.35 miles at 11% grade

Clement Road

Gulick Road


Highlander Staff member Ken lays down the road signs for the event in 2 weeks. He has traveled many places in the world and was an interesting man to talk to! He offered me a bottle of gatorade or something like that from his car and wish me a good journey.

Eelpot Road

Strong Hill to Blodgett Road

Mattoon Road, after Route 53


An Amish lady is busy with her work at the farm

Descent into the rural town of Prattsburgh, NY


This ends the Highlander route. I catch a diversion - Italy Hill Road heading north.

I pass the towns of Italy and Rushville NY

Descent along Co. Rd 1 onto the eastern side of Lake Canandaigua

This is definitely a first, having explored both the eastern and western sides of the Lake

Leaving the town of Canandaigua

Homebound on the 332

Homebound on the local bike path in Rochester. It is dusk here. This ends 10 hours of cycling.
* * *
Friday, August 20, 2010
42 Modern Bicycles and Cycling Speeds : Any Measurable Relation?

Its not about the bike. Or is it?
Without a shadow of doubt, most of us will say that today's Grand Tours are faster than those of the past. True. For instance, since its inception in 1903 to the 1990's, the Tour de France had seen its winner's average speed increase some 50-55% as this site will show.
But here's the big question - how much of that speed increase came from bicycle improvements alone? If you don't factor in the contributions from all other things- temperature, course, race tactics, improved training methods, nutrition and doping - what role does bicycle technology alone have to play in higher speeds? Is it significant to be appreciated?
This most entertaining problem is one that maybe analyzed with a technique called multiple regression. This method, a staple in any statistician's arsenal of tools, allows one to estimate the effects of many factors on a single dependent variable, in our case - cycling performance.
For starters, there are a number of independent variables that factor into a favorable cycling performance. I have shown these factors diagrammatically below.

In my opinion, these independent or explanatory variables can be broadly termed into 4 categories :
1. Human Performance Related - Physiology, training, nutrition, medicine and doping
2. Technology Related - Bicycles, fancy apparel etc. We'll disregard other things and consider just bicycles.
3. Race Specific - Course, weather, tactics employed, rules, etc.
4. Random Events (Noise) - Example - a freak crash 2 km from the finish line that injured many riders, a neutralized stage due to the death of an athlete, any day to day variation that cannot be predicted but is present.
In 100 years of cycling history, innovations have come and gone. Some have stuck through to Grand Tour racing, the list of which is mandated by the final word of the UCI.
To consider the effect of just bicycle technology alone on cycling speeds, a multiple regression analysis has to be performed. You would require lots of data for many years and a handy computer to make some meaning out of it. Unless someone gives me serious money, I won't be diving into such an endeavor.
But recently, Ph.D's Jan Heine and Mark Vande Kamp who write for the magazine Bicycle Quarterly sought to answer this question in their article titled "Are Modern Bicycles Faster? An Analysis of Tour de France Speed". To me, the article appeared to be a logical investigation of why speeds increased in the Tour and whether they could be explained by the latest racing bikes.
The article had ignited controversy in cycling circles about its apparently "flawed" analysis. I think it will be to everyone's benefit if the strategy of the article's investigations are clarified first and foremost. We'll then explore its conclusions.
Here's the strategy behind the article's investigation :
1. Fundamental assumption : The fundamental assumption that the authors imply, but which is not stated explicitly in the article, is that all modern bicycles and related technology are introduced into the market to strictly increase cycling speeds. With this assumption, they proceed to quantify how much that speed increase is.
2. Eliminate day to day performance variations : They selected the Tour de France as the main race of interest with this notion that multiple stages and over 150 riders will eliminate the influence of day-to-day variations in fitness, weather and other factors on individual performance.
3. Eliminate course specific variations : With the view that courses change "somewhat" in the Tour de France, they selected the Milan-San Remo as a supplement in the analysis as the race has been run on the same course for over a 100 years without change. The race's difficulty has also been consistent since smooth speed curves have been displayed for over a century.
4. Separate human performance improvements from bicycling technology improvements : This one is tricky so pay attention. The authors wanted another race as a control to compare cycling with. They thought of a race from another branch of endurance sports that had little to do with technology or inconsistent conditions and where performance was mostly limited by the "human factor".
They selected medium distance running, specifically the 5 and 10 km running race from all events worldwide and studied trends in running speeds. The logic? If bicycles have truly become faster, the trend line for cycling speeds in the Tour would deviate from that of human speeds in running by showing step increases. If bicycles have not become faster, the trend lines should closely match each other due to the "human factor" common to both endurance sports.
5. Regression Analysis : Using the data of speeds, a regression analysis was performed on the Tour de France and running speeds for the last 100 years. The "athletic performance" regression lines would show the long term speed trends for both races. This was made into a "Chart 1". "Chart 2" was also made where the authors smoothed TdF and 10 Km running speeds for many years by taking a 5-year running average. These curves were compared to each other and to the long term "athletic performance" regression line in Chart 1.
Summary Of Results :
1. Co-relation between actual TdF speeds and speeds predicted by the runner's trend line was 0.94. Strong.
2. Co-relation between actual running speeds and the long term running speed trend line was 0.95. Also strong.
3. 88% of increases in TdF speeds over the last 100 years can be explained by improved athletic performance.
4. For both running and cycling, there appears to be an unexplained 9-12% that are simply random occurrences seen when athletes compete.
5. The regression curve (or line fit) for TdF speeds have a shallower slope than that of running indicating that cycling speeds increased at a slower rate. The authors propose that this is due to wind resistance factor in cycling as power demand increases by the cube of velocity. But the non-linearity of aerodynamic resistance is not much, it is instead minimized in the Tour de France and spread over a large group of riders.
6. Over the last 20 years, TdF speed increase trends parallel that of runners' speeds. Technology has had minor roles to play in these achievements according to the logic in the analyses (no step increases were observed).
7. There were steeper speed increases in the TdF in between 1926-1940 than running speeds during that time. The early 1920's saw periods of low performance and the authors propose that World War I had depleted the pool of cycling champions taking part.
The late 1920's, however, showed a marked speed increase was not observed in the Milan San Remo which got the authors to conclude that something particular to the TdF caused these increases. They propose the radical shortening of stage distances as a possible reason.
There were pronounced speed increases in the 1930's that corresponded well with the significant, revolutionary and long term changes introduced on racing bikes such as lightweight steel frames with thinwall tubing. The authors state that of all advances, lightweight steel frames had the most pronounced effect on Tour speeds. These speed increases were also observed in the Milan San Remo in the 30's as well, indicating that this was a sport-wide phenomena.
8. Since 1947, speed increases in cycling, relative to runner's speeds, came during times when cycling technology did not even change. The late 1950's saw a jump in cycling speeds but nothing significant was invented or innovated in bicycles during that time, since the introduction of Compagnolo's rear derailleur in 1951. Since speed increase came at a time when technology was stagnant, the logical conclusion is that speed increase cannot be explained by technology. The authors state that other reasons, like the paving of roads, may have been primarily responsible.
9. In the early 1980's, TdF speeds increased between 1981-1982 without a rational reason and then dipped down without an explainable reason as well. Between 1985-1990, time trial bikes, such as those used by Greg Lemond in his 1989 Time Trial did increase stage speeds but the time trial stages were too short to influence overall speed of the entire Tour. Moreover, the bikes used in mass-start races "evolved little" during this period, wrote the authors.
10. From 1999-2009, lots of things in bicycles evolved - from index shifting, to rear cassettes, increased gearing, aerodynamic wheels and ceramic bearings. Sure, the speeds of the Tour de France saw an almost linear increase as well. But what the authors found was that the long term trend of running speeds tracked this increase in cycling speeds very closely indicating that almost all these improvements can be tracked to physiological factors common to both running and cycling.
Since 2005, speeds started to drop below the predicted trends, possibly indicating that strict doping controls are responsible for the lower speeds. Speeds decreased 3.5% from their peak, while running speeds decreased only 1.8%. This shows that something not common to both sports have influenced the speeds in cycling.
By now, you must be tired with all this information overload. So let's take the justifications provided by the authors for speed fluctuations and plot it on a chart for the last 100 years. I did it below for you :

Conclusions :
The authors wrote that there is no evidence that advances in cycling technology since WWII led to faster racing speeds. There is no systematic co-relation between the two. Some speed increases came during times when athletic performance as a whole were increasing. Others came at times when bicycle technology and innovation were stagnant. The only period where bicycling technology led to a pronounced speed increase was during the 1930's with the introduction of lightweight steel frames. Bottom-line of this whole affair is as follows, quoted from the article :
"It is tempting to look over the Tour de France speed curve and pick [technology] factors that appear to have caused increases or decreases in speeds. [...] However, when taken in the context of all the data, these specific examples don't add up to a compelling case that bicycle technology increased Tour de France speeds. Neither of them stand up to close scrutiny. [...] Across the whole timeframe of the last 100 years, even radical changes like the introduction of the derailleurs did not alter the trend of Tour de France speeds. Clearly, the larger pattern suggests that bicycle technology has had little, if any, effect on racing speeds, especially in recent decades."
Critique & Suggestions :
1. Choice of control : Why was medium distance running chosen as a control and not ...say, the marathon? I don't know. The authors don't provide an explanation for this deliberation, although they suggest that the medium distance races do not see much "influence of technology". So does the marathon see influence of technology then? I don't know. You would think not. Long distance running, to me, is the purest form of endurance sports. It would be interesting to see if marathon running speeds closely followed all the trends of cycling speeds for the past 100 years.
2. Choice of race : One will agree that are simply too many variables in the Tour de France to make a valid relation between one aspect, such as cycling technology, and another aspect, cycling speeds. Why not extend the research to a solo performance such as the hour record where variability is reduced even further? Or a time trial? Or a sprint? In a past post, I revealed details of a study that found that between 1980 and 1990 before UCI regulations came about, 60% of cycling hour records in the discipline were solely due to engineering. The authors may want to catch up with that.
3. What to investigate : The authors start off the article by asking the question - how much faster are the lastest racing bikes compared to classic machines? But it seems that throughout the article, they tend to look at small innovations across years such as the rear derailleur, or increased gearing, or thin walled tubing to see if they made an effect on the "overall" speeds of each year's Tour. How could does a tiny component translate to anything appreciable in the overall speeds across successive years? Rear derailleurs or improved front brakes alone don't make any appreciable change to Tour de France speeds across successive years.
4. Details of each stage : The exact details of each stage were not investigated by the authors. It would be interesting to see how many flat stages and how many mountain stages each Tour so far consisted of and how gravity would play a role in changing outcomes. Data may be tricky to find. Now keep in mind that we do have data for the speeds, distances, number of entrants and number of finishers in each of the Tours. Perhaps blending all this information into one graph for different eras of cycling may lend some insight.
For illustration, lets take the Hinault Era (1978-1985). I plotted speed (kph), % of entrants who finished the race, and number of stages with respect to the years and the distances involved. Check this out :

You may be able to come to some kind of understanding about what was going on in those 7 years. For instance, during 1980-1982, speeds increased drastically. It is also interesting to see that between 1980-1981, the number of participants who finished the race had also risen and the distance in Km of the race had fallen, although the number of stages were increased from 22 to 24. It would be interesting to superimpose the percentage of km in uphill roads and downhill roads on this graph for those years. It would also be interesting to see how the "Badger's" temperamental tactics and pace control influenced the speeds in those years.
5. Successive yearly investigations vs leaping : Based on the initial question posed, it would be more meaningful to take a vintage racing bike and a modern racing bike and compare the two. Hypothetically, a 1903 racer traveling across a period of 100 years into the future to ride the Tour de France on a 2010 race bike with a lighter frame and aerodynamic wheels should be faster. Similarly, a group of 1903 racers climbing a 2 hour long Alpine climb on 40 pound steel bikes would be slower than the same group of racers riding on flyweight machines of similar sizes in similar terrain. It is basic physics.
Investigating this issue year by year, where all riders would have access to the same bikes and the same technology won't show you clearly how cycling technology is improving overall Tour speeds, if they do at all. Besides, some modern equipment and technical wear don't always serve to increase speed solely. Some of them have intangible benefits as comfort and so on. That is an advantage when you stay seated in the saddle for 90 hours of racing.
Overall, I don't think this is as bad of a study as many people think. Besides, it was published in a popular magazine to open up a forum for discussion. It is not a rigorous scientific white paper.
I do agree with one thing that studies like this discover time and time again - that majority of racing performance is related to the human body.
Racing is never a level playing field, no matter what race it is or how much you want to complain - be it the Berlin Marathon, or the Tour de France, the 24 Hours of Le Mans or the Baja 1000. There's always those few individuals genetically gifted or blessed with the finances and talent needed to win.
Then there are those who cheat to win. They may have the talent, but they want to boost it with some extra energy from extraneous sources, illegal by all rules.
Kamp's and Heine's study corresponds with several people's observations that cycling speeds have been coming down since 2005 due to doping regulations. In July during Tour time, I had done my own analysis of this Stage 17 power to weight ratios and my approximate figure of 6 W/kg agreed with other people's observations, among them the Science of Sport bloggers (see their article).
In the end, we may never know exactly what portion of those early TdF speed increases were "fabricated" through cheating. How much came from Amphetamine use, or alcohol, or narcotics, steroids, growth hormones, EPO and blood transfusions or using mechanical devices? Food for thought?
What do you think? Come discuss this article and its implications!
* * *
Tuesday, August 17, 2010
19 Cycling Shorts : August 17, 2010
1. Prince McQuaid keeps room open for donations : According to reports, the immaculate cycling chief McQuaid has said that in the future, the UCI "may deal differently" with a donation like Armstrong's. But he insisted that it depends heavily on donations from all riders and teams to support its annual $6.4 million anti-doping budget. Wow! This must happen only in cycling. Please audit this organization as soon as possible. The sooner the better.
2. The subject of Armstrong surely divides opinions. The latest Facebook groups that have come up to gather support for each of their causes are "Petition To Drop The Federal Investigation of Lance Armstrong" and "Petition To Investigate Lance Armstrong For Fraud". The bottom-line logic of the pages are something like this. One has it that investigating Lance Armstrong is a complete and utter waste of taxpayer money and that he should be let "free" because of the things he has done for the cancer initiative. The other writes that using taxpayer money to investigate fraud on such a massive scale is a non-issue, and interestingly, is also in support of the research on cancer so that definitive links can be established between drug abuse and cancer. Both sound equally reasonable.
3. Jeff Novitzky fanpage : Meanwhile, what appears to be a psuedo Jeff Novitzky is fast becoming a celebrity on Facebook as well. He must be the modern day manifestation of all our childhood fantasies about steadfast, no-tables-unturned, mission oriented crime busting.
4. Is the Cobra trying his venom already? This is the second time Riccardo Ricco has fooled us. Here, it was Quickstep. A few days later, it is now a Dutch team. I don't trust him. I think he's still lying and will surely ride for the Reptile Rescue Committee of Italy instead. Hey, that's just me.

6. Side Mounted Pedals : Recently, I was shown the side mounted pedals by inventor Steve Lubanski. While his pedals have been around for quite some time, it is only recently that I noticed it. It seems to me that you can get your seatpost lower with the pedals, thus lowering your center of gravity. It also appears to me that your crank length will closely match your true crank length since there is no vector addition due to the stack height offset. But will 2-3 cm of pedal stack height reduction really make that much of a big difference? Physiologically, validation could be best done with a bio-mechanical as well as power output and oxygen cost study. I might write more about this later. The subject has interested me.

What do you think? Got anything to share? Write in!
Monday, August 16, 2010
1 Useful Cycling Devices
As a touring cyclist, I am well acquainted with the fact that almost all cycling advice and almost all cycling equipment is made for the high-tech, high-speed, ultra-light, streamlined cyclist. We hear of the need for cyclometers, cadence monitors, altimeters, heart-rate monitors, and combination devices that can record and print back the entire trip. But did you know that touring cyclists have their own high-tech devices? Here are some of them:
The Realometer was invented by H. Thoreau (a former pencil manufacturer) and is designed to measure the truth behind appearances. In 1968, Postman and Weingartner called this "an instant, built-in, crap detector." This device is useful for measuring the truths of statements such as the following: "This back road here's too dangerous, but that main road over there is very safe." "My dog snarls, but he don't bite." "It's downhill the rest of the way." "Turn left at the second light, go several blocks, and turn right. You can't miss it."
Just as you can conveniently record your speed, cadence, altitude, and resting, pacing, climbing, and maximum heart rates, now, with the Meteorological Max Kit, you can record all the meteorological data at the same time, maximum and minimum temperature, precipitation, barometric pressure, and solar intensity. The company will even sell a program to allow you to statistically correlate all these events. Does a hot sun really slow you down or speed you up?
The Sunrise, Sunset, and Rainbow Recorder was designed to measure and record daylight phenomena the cadence-conscious cyclist can now without guilt ignore. The same company produces a Moonbeam, Starlight, and Falling-Star Recorder that measures and records evening phenomena the same way. Soon to be marketed is a wild animal counter for the Nature lover as well. This last device will keep up with the individual species for you, so you don't have to bother. It even has a roadkill switch allowing you the option of counting or not counting these animals (some people consider counting roadkill to be cheating; with others, that's all they've got).
The Automatic Panorama Device detects any scenes that could be described as beautiful, scenic, or panoramic. This device has three switchable options: Alarm sets off a buzzer, so you can lift your eyes off the cyclometer and glance around; Record does not disturb you, but makes a record of the occurrence for a later trip report; Camera will work with an attached wide-angle camera or video recorder to capture the scene without disturbing your concentration.
The Blood, Guts, and Awful Flames Detector will set off a loud buzzer whenever you near a fatal traffic wreck, burning gasoline truck, or spilled train tank car. This was the one device I found to be unsatisfactory. I found I could pass two or three cadavers before it would finally go off. Definitely, the device needs to work before you get to the accident.
The Instant Poetic Inspiration Device is not as instant as the makers claim. Before it will produce a single poem, you have to hook it up to a PC or a Mac, and you must have a 233 processor and 32 megabytes of RAM. Nonetheless, the device did produce poetry that was judged as good and as understandable as anyone else's and did so without requiring one moment's reflection. [Note: the software in this device has recently been updated to make it compatable with Windows 98 and Windows 2000; it now requires a Pentium III and 128 megabytes of RAM and works nearly as well as it did before; a Macintosh version is no longer available.]
The final device is the Prevaricator. Certainly, no device was ever needed more by a cyclist. This device helps you expand your mind set, so you are equal to cyclists who are older and more experienced than you. If one says, "I have ridden to the top of Mt. Evans (14,100 ft.) in the summer," you can reply, "Well, I have ridden to the top of Mt. McKinley (20,300 ft.) in the winter," and what is he going to say to top that?
- Written by Ken Kifer , who tragically passed away on September 14 2003 in a bicycling accident
ADDITIONAL HUMOR
The Cyclist's Apocrypha
Tour of the Mountains Of The Moon
Tuesday, August 10, 2010
15 Crank Brothers Candy C Pedal Failure : 2

Those Chinese made Crank Brothers Candy C pedals, whose flaws we discussed in an earlier post, has obtained another victim. The pedal failed in the same area again. A reader, who describes himself as a relatively non-litigious person, emailed me his story with pics of his injuries along with the broken pedal spindle. He describes this as a serious design flaw and wrote that had he crashed while going downhill at speed instead of the top of the hill he was riding on, he may not have lived to tell the tale.
Some good people had noticed his crash and rushed to get him to a hospital. There, he would find out that he had broken his right clavicle in two places, not to mention extensive bruises and abrasions. "It hurts like hell, inspite of Vicadin", he wrote. The healing process takes 8 weeks, or 2 months. How would you feel if your summer was ruined like this? We do hope him a quick recovery.

Fatigue is the biggest limiter of products whose design goal is to take cyclic loads and is often the prime reason for failure. Overlooking the design or manufacture of such items to combat accumulated fatigue leads to reduction of its life prematurely, that may result in serious injury or death. A rough back of the envelope calculation of mean and alternating stresses in a pedal spindle was done by me in the previous post for perspective.
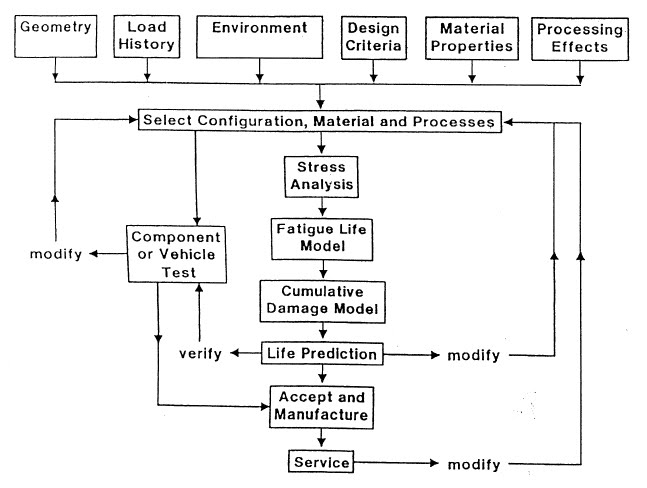
Simply relying on safety factors alone does not take care of this important issue. The synergistic effects of product design geometry, heat treatment, loads imposed, environment, residual stress and time can all reduce the lifetime of a product. It is common practice to see companies show off their computer skills with exquisitely colorful FEA. This is not the end to the fatigue design process either. Verification has to be absolutely thorough. If you don't test the item, which is for public use, by simulating real world conditions, you can be held guilty of negligence.
This is the flowchart that the SAE likes to follow for designing against fatigue. Observe that the word "modify" shows up in three different spots.
How safe do you want to be? I hear that something like one major air accident everyday is considered a 99% safety rate as far as air travel goes. Anyway, the company Crank Brothers has babysat the individual in question with a new pair of Candy C's. Everything is safe. Don't you worry, here's a band-aid. This was just another outlier.


* * *
Saturday, August 07, 2010
19 Alex Moulton Explains His Design Studies
Dr. Alex Moulton is a source of inspiration for me as a young engineer. I encourage you to watch these videos to see how a great mind thinks. The message couldn't be clearer. Good engineering is a hands-on job. If his biography weren't so expensive, I'd voraciously consume the book in one sitting overnight.


RELATED READING :
Mark Sanders Explains His Strida Concept
Design Case Study : Innovation Of The Brompton Folding Bicycle
Subscribe to:
Posts (Atom)


