Wednesday, July 28, 2010

19 SRAM Force Brake Housing Failure

I had written a post a month back reviewing the story of a SRAM brake lever housing failure, belonging to an individual who maintained that when his mechanic called SRAM to find out what the issue was, the reply came back from the SRAM employee something to the like of  "oh yeah, we knew about that, you know...we injected some extra air in the part during molding...." SRAM didn't inform consumers that this incident had happened in the manufacturing phase and let the product sell. The brakes cost almost 200 dollars in retail value.

The comments in that post were also interesting. You should really read them. One individual who is an ex-Ciamillo employee wrote to me that something very similar in substandard manufacturing practices was happening with the highly expensive Zero Gravity Gravitas brakes. He was frustrated with the owner, who felt to him like all he wanted to do was produce more brakes without a care in the world for people's safety. He left the company shortly. Now those brakes sell for a staggering 875 dollars a pair!

Anyway, the story about the SRAM brakes is not a mere anecdote as now more pictures are coming in. So I thought I'd follow up on that last post.

Now the same housing failure happened to two other people. The power of my blog lies in being able to connect people's experiences across the world. One individual saw the post here in the U.S and wrote to me recently :


"The SAME thing happened to me! The plastic cover just shattered, a piece of it shot across the room. It was so odd. 20+ years of working on bikes and I’ve never seen anything like that."

Here's an image he sent me :


Another individual in Ireland could also relate to the incident. He had a similar nightmare with his SRAM gruppo, documented here. The characteristic housing failure did not escape him either.

"Brake cable goes inside the clamp, I adjust the brakes to where I want them. Put my torque wrench up and start twisting when pong!, something goes flying. Immediately I start scanning my torque wrench thing, crap I’ve broken my torque wrench. But no, the brake quick release housing has decided to give up. Firstly, the manual says tighten to 6-8nm. My torque wrench was set to 5nm. Yes I know it was light but I’d rather be safe on the initial setup of things, so I usually do a lower torque first then go back. Well in this case it didn’t matter."


Here's the image he referred me to.


The attitude the company has to such incidences is also interesting to learn. According to a blogger who raised this issue on their website, a SRAM public relations rep tracked the post down and allegedly barked at them via email, "Why are you talking such nonsense about plastic QR's breaking? The brakes still work. Please take the post back, people understand this is not a problem." 

I see. Without letting people know about the problem, obviously their understanding will be that its not a problem!

Please be aware of this issue and contact SRAM with your concerns. If they do not redress your problem, just shoot me an email and I'll try to help.

CONNECTED READING :


*  *  *

Sunday, July 25, 2010

11 Tour TT Statistics & Contador's Climbing Abilities Reviewed


The 2010 Tour de France, the last one of this decade, draws to a close. Alberto Contador, the consummate cyclist of our times, has nearly clinched his third Tour de France title as he and his team roll into Paris today. This will be his 5th Grand Tour win in a row, and he has everything under the sun from the Giro d'Italia to the Vuelta a España. He is at the level of Lemond, Bobet and Thys. Meanwhile, Andy Schleck made slow but steady improvements in his time trialing to give El Pistolero a serious run for his money.

TT STATISTICS

I was hoping to shed a bit of interesting light across both last year's and this year's time trial stages at the Tour. See below. 

1. 2009 TdF Prologue.  Let's go back a year. This was the profile of the opening prologue if you'll recall :


This was how the resulting times played out.


A nearly normal distribution. I used a 0.2 minute bin width. 180 riders started, gave their best. Average time was 20"20' and the average of each rider's time variation from this mean was 0.63 min, or 37.6 seconds. More people tended to perform better than average than not. It was short. Legs were fresh so a violent effort. There were 2 or 3 out there in the land of under-performance.


2. 2009 TdF Final TT.  This was its profile :


This was how the results were distributed. 


By stage 18, just 158 riders remained to time trial compared to 180 who had started. 22 riders said "I'm done, thank you very much", that's 12% of the peloton who were missing. Contador surprisingly, beat Cancellara by some precise pacing strategies (a topic that was explored in depth by the SportsScientists). The fastest guys could do this 40K course (25 miles) in 48 and a half minutes. Andy Schleck performed better than 86% of the rest and he was 1 min 44 sec slower than Contador. Menchov posted just close to average times but he must have been toast from the long Giro season earlier (racing against a doped up Italian challenger is not so easy, as it goes). Towards the end, everyone must have been cooked 80% anyway. More riders tended to perform slower than the average times. 83 are slower than some 72 . The average spread is close to 2 min.

3. 2010 TdF Prologue. This was its profile. A much shorter route than last year.


This was how the results were distributed.


The fastest man covered 9K in 10 minutes. Contador, meanwhile, didn't give his best like last year. Taking it easy? A big field - 197 riders - raced, posting a mean time of a little over 11 min with a spread of just about half a minute. Schleck was embedded in the average. Menchov was slightly better than him. Overall, again, more riders tended to go fast with violent effort and perform better than the average than not. A few were cast way out in in the world of under-performance. What on earth were they thinking?
 
4. 2010 Final TT. This was the profile. Very flat but was this a welcome respite for the riders?


 Not really. This was how the race results played out.


The headwinds were brutal. But again, the same names were out there in the front, the best guns (Martin, Cancellara) could pedal a little over 30 miles in an hour. Stop to think about that. And the average time was 1 hour 8 min or so and the spread much bigger than last year - almost 2 and a half minutes. More riders tended to perform worse than the average. Over 85 riders were better than the rest. Contador appeared to be struggling. Schleck, who does better than 73% of the field, is even worse than Contador, but just by 31 sec!

Menchov, though, was the big surprise as he had a big leap in performance - what I'll call a 2x2! He raced faster than Contador, beating him by almost 2 mins. Furthermore, he had beaten Sanchez by exactly 2 mins to seal that 3rd place on the podium (the most un-talked news yesterday). Also note that out of 197 riders who began the Tour, 27 riders had quit, meaning 14% of the peloton were missing. Comparable to the 12% last year who had also quit by the final time trial.

From all this data, one can understand that the Tour has been even getting challenging for riders and the number of casualties are higher this year than 2009. Contador's placings in time trials have taken a toll over the last one year. He has not won a single stage at the Tour either. What is the matter, fans wonder? Illness again? Tiredness? Lack of ability? The champion who beat an ever consistent Cancellara last year looks vulnerable more than ever. GC contenders who want to beat him must tap into this 30 second time trial weakness.


CONTADOR'S CLIMBING PERFORMANCES

On the climbing front, Contador has posted consistent values in climbing performance over the past years. The following table was put together by me after reviewing a bunch of people's calculations. I took the averages of all their numbers and integrated them into the table with average VAM's. This will hopefully average out the error from each person's math, instead of sticking to just one inflated/underinflated number.


With these approximations on the climbs, we find Contador stands somewhere at 5.9-6.1 W/kg average in Grand Tours, not considering the 2008 Giro d'Italia. The big surges in performance were on the long climbs at Verbier and Angliru, which were massive efforts and on the short-steep Côte de la Croix Neuve, which was a little over 1 mile long and 10% average in average grade. That must have been one violent effort to cut 10 seconds into Andy's time. Readers can verify these numbers or put a reality check on it if they choose.

It will be interesting to see how Alberto Contador and Andy Schleck perform in future. Thanks to them for what will be great memories.

For your pleasure, here's the Col de la Croix Neuve attack from Contador to top this post off.


*  *  *

Saturday, July 24, 2010

35 ABC Nightline Interview With Floyd Landis

UPDATE : It looks like ABC got rid of the Nightline interviews with Floyd Landis which were on their website upto this afternoon.  They suddenly disappeared. We obtained another full copy of the show from Hulu.

I recorded almost 15 minutes of it, but missed out the last 2 minutes of the ending sequence with Betsy Andreu, who came across as a very bold, confident woman not afraid to face the cameras. The whole interview as televised was short, much to my chagrin, in spite of ABC claiming they had over 90 minutes of talk time with Floyd.

Main highlights of the Nightline segment : 

1) There is no Santa Claus in cycling. He hates to break it to people. He's not afraid to tell it. 
2) If Lance didn't win the Tour, someone else would have won it and every single one of them was doped to the gills.
3) He was given testosterone patches by Lance Armstrong.
4) He saw Lance take PED's like EPO and blood boosters at several training camps "multiple times".
5) Team U.S Postal riders would dope on the team bus, 300mL of blood or so typical.
6) The team checked into several anonymous hotels to dope. Techniques, among others, included taping blood bags on room walls overhead. Gravity then played its role as the blood entered through the veins of the riders. One or two doctors always supervised.
7) He feels relieved telling the truth. He never felt at ease lying before.

Full episode (only available in the U.S) :


The following are low quality backups (with sync issues) in case Hulu decides to go zulu on us : 
 

Thursday, July 22, 2010

20 Col du Tourmalet Climb Analysis From 2010 TdF Stage 17

Today's mountain top finish involved the climbing of 18.4 km of the western side of Tourmalet (see detailed 3D terrain here), from Luz-Saint-Sauvier onwards. The Tourmalet is the queen of all climbs in the Tour de France and the roads here are some of the highest in France. The Henri Degranges prime was won on the summit by none other than the lanky, steely looking Luxembourgian Andy Schleck, but he did not manage to gain any time advantage on the Spanish climber Contador as the latter finished an inch away from him. Andy promised a strong effort today to aim one last time for the yellow jersey before the final time trial. It didn't happen as planned.


How It Happened :

1. At 18.4 to go, the leaders were in one group of some 10 riders. The speed, as reported on Eurosport at 19K to go was some 25 kmph. But this was on a mild gradient before the Tourmalet officially began (we can assume their speed dropped by 2 Kmph when the gradient kicked in) . At this point, they had 3:59 seconds advantage over the chasing pack.

2. When the leaders had 18K to go, the chasing group with the favorites had just passed the 20K to go sign.

3.       Time Gap 
 = Time To Finish (Slower) - Time to Finish (Faster Leaders)

Knowing the time advantage of 3:59s (0.066 h), speed of leaders = 23 kmph, and distances left for each as stated above, speed of the chasing pack at 20K to go is then calculated by :

Speed = 20 / [0.066 + (18/23)] = 23.58 kmph ~ 14.7mph

This speed is high as the sections before the foot of the climb were only gradual.

4. When the leaders were at 10.1 K to go, Carlos Barredo from the chasing pack attacks. The time gap to the leaders drop steadily per kilometer.

5. Andy Schleck who is also in the pack chances upon the opportunity to make something happen. With 10K to go he accelerated and passed Barredo. Contador marked Schleck and took his wheel. Both go hand in hand up the climb, eating up into the time advantage of the leaders (by now, their group had also splintered due to several attacks within.

6. The time gap drops rapidly per kilometer after Schleck's attack (see graph below). How rapid is the Contador-Schleck surge? In a matter of 1.6 km, they completely destroyed the advantage of 1:21s enjoyed at the front by Katusha rider Alexandr Kolobnev. He was caught and passed at 8.4K to go in a matter of 28:30s from the start base of the climb.

7. From hereon, Contador and Schleck are the leaders. With 5K to go, they had a 1:15s advantage on the chasers.

8. Alberto tested Andy's legs by giving it a go at 3.8K to go. Andy responded and trivialized the effort but surprisingly, he did not counterattack. Perhaps both may have found that they were at their absolute limits and hence decided to ride to the summit without any further attacks. There was no sprint to the line but the finishing speed as reported on Eurosport was 14.4 kmph, with a margin of 1:30s over the chasing group. Andy gave a hug to Bert on the summit while the latter winked at Andy and patted his face. "You know, we really are the best around here..."


Data & Calculations :

1. Weather : 10 deg C, low visibility with bit of snow in the morning, overcast with a weak wind from the SW, according to Metro News France. Wind can be consequential to the race. Racers like Carlos Sastre know it.  However without a CFD analysis or something similarly sophisticated, the wind vectors are hard to predict given the number of switchbacks, trees, spectators & vehicles. A theoretical analysis of its effect on power to weight ratio was given here for perspectives sake.

2. Procedure : Climb profile divided into 18 sections was borrowed from Velopeloton. Grade was extracted for each individual kilometer. Using a mammoth Eurosport footage recorded using 18 GB of hard drive space (phew), the racers were timed on these 18 sections using my stopwatch with an error of +/- 2 sec. Time gaps/advantages and VAM's were also extracted/timed from the footage video. Power to weight ratio was then calculated with Ferrari's formula using VAM, taking into account the grade of each of the 18 sections. An analysis done this fashion, is a bit on the conservative side opposed to one assuming a constant grade and constant ground velocity. From the perspective of drafting, this analysis is a bit on the overestimating side. All in all, the VAM method is between those two. So for Watts/kg, it is good to represent a figure obtained from this method with an error tolerance of +/- 0.2 W/kg.

3. Change of time gap per kilometer : As shown below : 


4. Climb Time : Time taken by Contador & Schleck to complete climb was approx. 53 mins 25 seconds for 18.4 kms according to race footage. However, from Horner's power output file, it was determined the he took some 52 minutes 22 seconds to climb which puts the leaders at 50:37. This is the figure I will use (with some caution because this depends on how it was operated on). It is quite challenging to put this into perspective with previous editions of the Tour. Data is lacking and I have had to pour into past Cycling News reports to extract any sort of approx. information. I have put together what I could glean in the following table. Please do review it, correct me, or help me fill in the blanks if you can. 


5. Average speed for climb : Av. speed of the duo from calculations (after passing Kolobnev) = 12.62 mph for 8 km. From Eurosport live online, their finishing speed was recorded to be 9 mph. 

6. Average power to weight ratio : Prior to getting caught, Kolobnev and his group exhibited approximately 5.5 W/kg +/- 0.2 W/kg. Average for Contador-Schleck was 6.03 W/kg +/- 0.2 W/kg for 8km after passing Kolobnev. See speed and power to weight ratio below :


7. Climbing Rate (VAM/Ascention Speed) : Average VAM or climbing speed (see detailed explanation for climbing rate) after Schleck and Contador overtook Kolobnev was 1696.5 m/hr. The change of VAM with grade is exhibited below for the parties in the Kolobnev group before the catch and the Schleck-Contador breakaway after the leaders were caught.


Power Meter Data


Both Chris Sorensen and Chris Horner put forth hard efforts during the climb. Surprisingly, Horner made it with the group of chasers and he was the best placed Radioshack rider. As and when I see powermeter information about their efforts, it will be appended here for review/comparisons. The trend of releasing powermeter data is limited in that it monitors only a few riders for a limited amount of time/kilometers before they are expended. But it is should be the most objective indicator of performance, while heart rate is the best indicator of effort. 

UPDATE : Chris Horner's Power Output file from SRM is shown below. His average power output is 5.65 W/kg for the entire climb. Relates very well to my estimate envelope of 5.5 +/- 0.2 W/kg as stated above. Notice that SRM missed out on publishing this cyclist's HR value. It is absolutely important to know his effort intensity level. Viewing such information without HR is as good as no information.


Some Limited Footage


Found on Youtube for your pleasure : 

Part 1 :

Part 2 :


*   *   *

Sunday, July 18, 2010

15 Cycling Shorts : 18 July 2010

Lots to report on in today's shorts.


1. The doping saga continues : The truth is out there. TREK and Lemond have been subpoenaed this past week! The NY Daily News is at the height of their game, reporting on the minute-by-minute news in the doping drama with great finesse. Yesterday, the German newspaper Sueddeutsche had published mindblowing details of an interview with Lemond. Among the things Lemond told journalist Andreas Burkert was that Armstrong had vowed to pay $300,000 to an "active member" of procycling if the latter went public and lied that Lemond used illegal EPO to win stages. He also told the paper that he had first heard of the secret "double donations" to the UCI through a mechanic within U.S Postal. The first page of that interview has been translated to English here. NYDN has also ran a summary of what was exchanged.

2. Vino inspires emotion : Yesterday, I happened to put together a small biography on Vinokourov, the breadth of the work sourced from Daniel Coyle and English translations from www.Gva.be. Some commented in and called me a 'selective hater", others had some other names for me. Still others continued to judge Vino as a remorseless doper. Most, however, liked the post. I loved the variety in the discussion it brought. If you have stories to share about Vino, please chime in there and add to it in the comments section.

3. NYTimes goes behind the Livestrong money machine :  Many consider Lance Armstrong a failure this year, both on the racing and personal integrity front. But Juliet Macur wrote recently about the second team of people he has got to give that much needed boost to his PR image. The Livestrong camp (a charitable fund that has very high overhead costs, no special news to Charity Watch) is busy at work hawking wrist bands and merchandize for a good cause, so they say. These are young adults recruited and paid by Nike to go around driving in black cars and trucks commercializing cancer. Meanwhile, Armstrong continues his magnificent Global Cancer Awareness by making direct 180 turns after he finishes a stage to flee for the shelter of his team bus. While you ponder what's going on, did you know that FRS energy, the health drink company which he has a stake in, donates a gracious dime (10 cents) to LAF for every $40 dollar CASE of cans sold? The fact that people think the drink outright sucks must not be helping either.

4. Should Alberto demand his gift back? : Let's see. Among the minority of people who've been having  major women's issues with Contador attacking on Friday is a whining Johann Bruyneel, who recently pocketed nice gifts from the Spanish champion too. Here's what he said, even stamping his authority on it by claiming "I know what I'm talking about." This comes in stark contrast to other people's opinions that Contador is a changed rider this year tactically.

Keep in mind that the flawed "coach, champion, legend" has no business interfering with Astana's affairs any longer nor has any idea what the team had been planning for Friday in their own privacy. Sure, he's entitled to his opinion but what is equally clear is that he still manages to hug tight like a pillow his puerile discontent for Contador from last year's Tour. Funny fact- Vino has no problems with Contador, thank you sir for your concern. The biggest irony of all this is that the nutcase manager has nothing whatsoever to say about his team's failure to help Levi climb up the GC. That such self-inflated garbage about another team's rider should come from a sore loser makes many want to simply vomit.

5. Power calculation from Tour stages : Frédéric Portoleau has a page put up where he has power estimates of various top riders from this year's Tour. According to him, Andy Schleck climbed the ascent to Avoriaz in 33min 12s, expending some 417W of power. That gives a power/weight ratio of 6.1 W/kg. Alberto put down 415W of power, making his power to weight ratio some 6.8 W/kg. Certainly seems way off the charts, so I'm not sure how reliable all this data is.

6. Most important Tour stage : The most important Tour stage could likely be today, as the riders ascend the second highest pass in the Pyrenees. Steephill has a preview of the course and a video of the steep east side of the climb which will be climbed today.

7. A small perspective of La Marmotte : Fancy doing the La Marmotte cyclosportive anytime? Our friend Will over at Cycling Challenge shows it was done :


8. Rating Climbs : Speaking of climbing and famous climbs, Will has also written a post on Podium Cafe, rating the different climbs in this year's Tour based on the formula from www.climbbybike.com. Below is the result of his work :


Meanwhile, reader and engineering blogger Dan Connelly loves to go out and explore the science of whatever he can get his hands on cycling related. He thinks that the climbbybike rating formula is flawed in several respects and his latest endeavor is to try and formulate a different non-linear equation based on some criteria.

If you guys are climbing a lot this summer, make sure you also read John Summerson's Guide to Climbing series. You can also read up on what the standard is for climbing bragging rights, something I explored in the past. So unless you're climbing and meeting the bragging rights standard, please don't bother bragging about anything whatsoever on your Facebook and Myspace pages.


*  *  *

Saturday, July 17, 2010

35 The Quiet Goombah


"The former Soviet state of Kazakhstan is the size of Western Europe, and is not so much of its own country as its own planet, a vast sameness of boreal forests and grasslands, boiling in summer and frozen in winter, a land the Soviets found ideal for growing wheat and testing nuclear bombs - 470 tests between 1949 and 1989, most of them thoughtfully done on Sundays, so as not to disrupt the happy productivity of the proletariat. The ensuing years have only added to its charms : the rivers are so syrupy with toxins that they can't manage the trick of freezing; the rails of the trans-Siberian railroad are so elaborately twisted by frost that passenger trains cannot exceed thirteen mph. Kazakhstan, in short, is the perfect hothouse in which young cyclists may bloom."[1]

That's where the story of a stoic all-rounder began. He mumbled softly in press conferences, but spoke boldly with his legs. His enigmatic persona was only overwhelmed by his resilient desire to win. There are few who possessed his attacking style, fewer who could bring the theatrics that he gifted to any race.

A little Kazakh - Alexander Nikolaivich Vinokourov - was born on November 16, 1973 to his farming parents. At the age of 13, he applied for a position at the Spartan-like sports academy of Almaty with the burning desire of becoming a pro rider. From then on, he and his 13 colleagues were given extraordinary harsh training; up to three times a day they gave everything they had in their young bodies, in series of continuous labor. One hour at the crack of dawn, a three-hour trip right after the first meal of the day, and then another 2 times, 60 minutes going into the red right after the obligatory resting period: an education that can either break or make a person.

"Vino became known as one of the hardest of cycling’s hard breed: the Eastern Bloc goombahs; riders who had been selected as children, their growth plates and femurs carefully measured by state examiners, their biotype profiles matched against that of a “superior child,” and who were duly whisked away to the barracks of various sports schools throughout the Soviet empire. Once there, their life became an endless series of training exercises, the governing philosophy of which was summed up by a former coach: “You throw a carton of eggs against the wall, then keep the ones which do not break.” " [1]


When he was 16, the big day had come. The sports academy didn't have anything left to teach Vinokourov and his classmates. The West, where the beating heart of cycling lay, was calling. In the fall of 1996, Gilles Mas, assistant DS of the Casino pro team, received a letter from the Kazakhstani national coach. The offer: the 6 best young guns of the entire batch. The question:  Could he land a spot in the pro peloton for these guys?

Mas decided to take two of them, on probation. The Frenchman realized that fitting in Vinokourov and Mizourov - the two chosen ones - wouldn't be so easy, so he decided to install them at EC Saint-Etienne Loire, an amateur team, for a year. 

He showed up at the French amateur EC Saint Etienne Loire in 1997 with a rucksack on his shoulder and a coach's note in his pocket that sketched out the outline of his story. The wall had come down, and Vino had come to race bikes.

Vino quickly learned French and adapted well, but Mizourov became extremely homesick and was replaced with Andreï Kivilev, one of Vino’s classmates in Almaty. Together, they found shelter with their host family.

Vino was not taken seriously. From the beginning to others, he looked like he was nine - bright blond hair, pink ears - with an affection for shiny shorts and fat gold necklaces. Coy, of brief words, he resembled a cross between a mafioso and an elf. At first people assumed it was because he didn't know French, but was that really so?

"He knew it was fine. He just didn't talk. His background was, and remained, a blank slate. His parents were reported to have been chicken farmers in Petropavlovsk, but he would not speak of it. When he did speak, which was about once a week, it was in short, pointed sentences, so simple that it was like listening to Japanese poetry :

I will ride hard today.
The hill is not steep.
I will attack them. " [1]

Mas immediately understood that he made the right choice, especially since Vinokourov was tearing apart the amateur circuit. Soon it is clear that he was way too good for the éspoirs. One year later, the Kazakhstani made his first appearance in the pro peloton. The neo-pro immediately won the 4 Days of Dunkirk and the Circuit des Mines; later in the season he would add stage wins in the Tour of Poland and the Tour de L’Oise to that.


From there on, things only got better, and that’s almost an understatement - the Amstel Gold Race, the Dauphiné Liberé, the Tour of Valencia, the Tour of Germany, Tour of Switzerland, twice Paris-Nice, twice Liege-Bastogne- Liege, summer Olympics Road Race (2nd), the Vuelta a Espana and stage wins in just about every stage race of importance! The stats are remarkable. In his pro career since 1999 up until now, Vino has had 108 podium finishes :  forty eight 1st place wins, thirty 2nd places  and thirty 3rd places. 

Talent, power, character, money: Vinokourov has plenty of it all. A house in Monaco, a huge villa in the surroundings of Nice, some real estate here and there in Kazakhstan.

"But the man who raises his daughter Irina and his twin sons Nikolas and Kiril together with his spouse Svetlana also has a very big heart. The boy that grew up in miserable circumstances never forgot  where he came from. From his first public celebration in his country, he brought gifts with him for his colleagues, who had to work with a lot less than he. He donated 5 brand new Pinarello bikes to the Kazakhstani Cycling Union, and his club in Petrapavlovsk got 20 cycling kits, including shoes." [2]

Perhaps the biggest sadness in his life came when he lost his classmate, the same friend and companion he had raced with in his young years in the 80's - Andreï Kivilev. The 29 year old Kazakh climber crashed some 20 km from the finish during the second stage of the 2003 Paris-Nice and lay motionless on the ground, his skull crushed, his ribs shattered. Next morning, he died in a coma on his hospital bed. The dangerous sport of cycling had taken yet another victim. His shocking departure was the reason the UCI even enforced the compulsory wearing of helmets in all endorsed races.

"We were always there for each other," said a heart broken Vinokourov of Kivilev. "We raced for the first time together in 1986, and took the same road through the national team to the 1996 Olympics in Atlanta. We turned pro at the same time, Andrei with Festina, me with Casino. To lose one of my best friends is really bad. We were such a strong gang; the Kazakhs are a strong family."

In memory for his friend, Vino founded the Andreï Kivilev Foundation, a charity fund that provides for Andreï’s wife and children, as well as for his parents, brothers and sisters that he supported during his career.  “Being a famous cyclist opens many doors. It would be a shame if I wouldn’t put that in good use," he said. "I want to make some people’s lives a bit more bearable than they are now, in my own way.”

A year after his comeback, in the same characteristic style, Vino eluded the best sprinters of the world today, won the stage and added another brilliant feather to his cap. Meanwhile, Ned Boutling, a strong Vino critic wrote thus about him :

"For 4 or 5 years, and in an era dominated by the monotony of US Postal victories set against the fading star of his T-Mobile teammate Jan Ullrich, Vinokourov had been the thrill-seeker. He could be a one-man firework one day, and embark on the most suicidal of escapades. And the very next day he could disappear altogether, only to reemerge a few days down the line in true Lazarus fashion. He was loved. You could even say he was best thing about those Tours." 


Any doubt?


[1] Dan Coyle, "Lance Armstrong's War"
[2] www.Gva.be
Many thanks to translation from Daily Peloton, stats from CQ Ranking, interviews from Cycling News, photos from Graham Watson.


 *   *   *

Monday, July 12, 2010

24 Wind & Altitude : Effects On Power To Weight Ratio

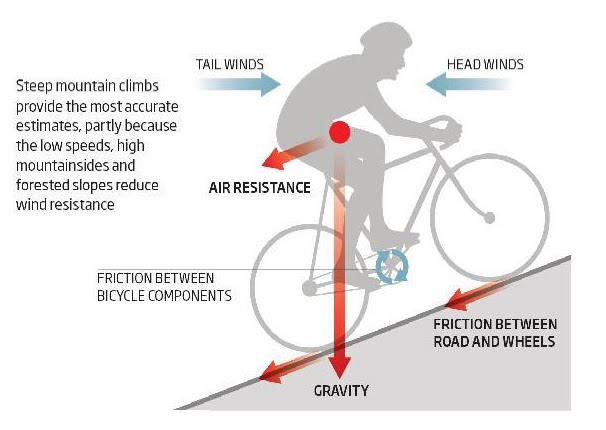
The following, divided into 3 parts, is a simple physics exploration of wind and altitude's independent effects on power to weight ratio, a subject that has not been treated by any cycling book so far.  Independent effects are important to understand in order to get a feel for how they affect power to weight ratio when acting in combination. The climb chosen is the famous Col du Tourmalet which is featured in this year's Tour. Assumptions in the analysis, for simplicity, include constant speed, constant grade and a formula for frontal area developed by Bassett & Kyle. Validation is done against calculations done by Alex Simmons (see conclusions) for wind vs power to wt results. Power models from Tom Compton's "Analytic Cycling" site and data from prominent researchers are compared with for altitude vs power results.

Courtesy : New Scientist

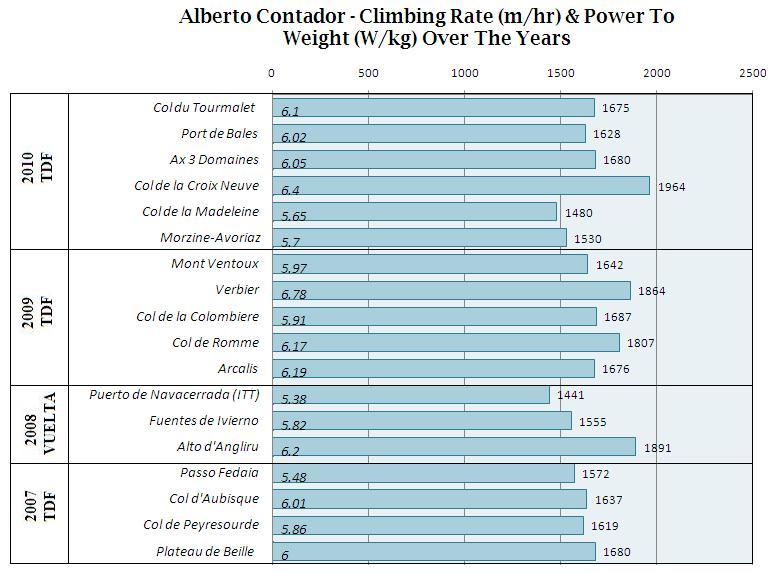
We have explored VAM calculations  here and here, However, climbing rate by itself does not provide an understanding of the effect of transient wind and altitude on performance. The wind and altitude can make a big difference. On the other hand, one could also argue that the effect of switch-backs and spectators along the road may effectively cancel out the contributions from head and tail winds. I'm not sure how much that contributes but that can be a topic in the comments section.
 
The equation explored in a previous post to understand climbing rate explored only the power needed to increase a rider's potential energy. Lets call this A. If W is total weight of bike and rider in Newtons, Vg ground speed in m/sec :

A = W.Vg.sin[arctan(grade/100)]  Watts

While this is a big piece of the power pie for climbing, there are  couple of other elements to the power equation. One deals with rolling resistance at low speeds. Let's call that B. If Crr is the co-efficient of rolling resistance (typically 0.004 or so for a 100psi tire)

B = W.Vg.Crr.cos[arctan(grade/100)]  Watts

Both A and B are constant if grade and ground velocity are steady.

There's a third element that comes to play which is the effect of wind and density. We can call it C. This is composed of frontal area A and associated drag force. If Cd is the co-efficient of drag (0.9 typical for cyclist on hoods) and this multiplied with area gives drag area, then :

 C = 1/2.Cd.Area

Say very little change happens with the cyclists' drag area (Cd.A where Cd is coefficient of drag and A = area), velocity V and say, density altitude is fixed as p. Let's also assume speed to be steady and gradient of slope to be an average. If  Vw is the wind speed (negative for tailwind) and Vg the ground speed, then not accounting for the tiny drive-train losses in your super efficient bicycle, the power to climb will then be a function of relative velocity as follows :

Power to climb, P  = A + B + C.p.Vg.(Vg + Vw)2  Watts

Let's work with just the third term, calling it Term. Its interesting to see what happens when you normalize Term by the the cyclist's ground speed on the climb. Dividing and multiplying throughout by Vg to change its form but preserve its meaning, we get : 

Term  = C.p.Vg3(1+ Vw/Vg )2

  => K.p.(1+ Vw/Vg )2

where K is defined to be K = C.Vg 3

Vw/Vg is called velocity ratio. Now you can see that when there is no headwind, Vw/Vg =0 and power becomes a function of K and p only. 


PART 1 : Power Variation With Velocity Ratio While Keeping Density Constant

Let's look at how that wind term varies with a change in velocity ratio. The density of the air on Tourmalet is kept uniform for this exercise, at a value of 1.06 kg/m3

When a headwind picks up, the velocity ratio increases from its baseline of  0. The following geometric growth is seen in Term :

  • -When headwind is 1/10th of cyclist's forward velocity, Term is an extra 21% compared to no wind condition. 
  • -When headwind is 1/4th of cyclist's forward velocity, Term is an extra 56% from no wind condition.  
  • -Similarly, when it is half of cyclist's forward velocity, Term is an extra 125% from no wind condition and you must supply 44% more power from case 3).  
  • -At an extreme case (assuming you're traveling atleast faster than 5mph), (1+ Vw/Vg) could be highest when the headwind is same as your forward velocity. When that happens, 1+1 = 2 and 2 raised to itself = 4 meaning that all things kept constant, Term is more than 4 times its original value, a 300% increase.  
But this component of power, Term, is added to A and B to produce power, P. Hence, percentage increases shown above don't mean the sum power will also increase by same percentage. So for the last case above, P does not increase by 300%. When one does the math properly (unlike my poorly done first edition of this article), the increase in P from a no-wind condition is actually  :

300% x [ Kp/(A+B+Kp) ]  

Or generally, if all other things are kept the same, 

% increase in power, P%. = [(1+ Vw/Vg )2-1].[Kp/(A+B+Kp)] 
increase in absolute power = P%.(A+B+Kp)
 

We know how to calculate the first part.  The second term, Kp/(A+B+Kp) can be called the Correction Factor. Once this puzzle is solved, we can solve for the proper required increase in power.

Without going into too many details, here are graphs I produced. Maximum height and weight were extracted from the Navy Seals' website. These are some of the fittest people in the world and they were a good choice because it makes no sense to work with data of unhealthy, overweight people. (Note, their dimensions are not like Tour contending emaciated cyclists but it should be close). Frontal area was then calculated using Bassett and colleague's formula that was retweeted by Jonathan Vaughters.  The speed is kept constant at 10mph.  p is kept constant at the average of 1.06 kg/m3. The gradient was uniform at 7.5%, with no change. 


FIG 1 & 2 (above) : First and second plots show the wattage expended to sustain 10mph on the Tourmalet for men and women. The numbers are shown for potential energy and rolling resistance components. Sanity check is to note that wattage needed to counter rolling resistance, for a constant velocity but varying rider weight (shown in red line), is pretty small compared to the wattage needed to fight the grade which is true.


FIG 3 & 4 (above) : Frontal area across riders vary with height and weight. The above plot shows how C varies for men and women according to their dimensions. These dimensions are the maximum accepted in the Navy Seals, who are among the fittest people. Frontal area was calculated using a formula developed by scientist Bessett & Kyle. The area is an approximation ofcourse, and does not account for changing positions on the bike. 

 FIG 5 : The last plot is the power correction factor plot, the puzzle I was seeking to unravel before. Does it make sense? Below, I describe how to use this plot to calculate percentage increase in the total power requirement. 

Going back to the question we were asking earlier : How much increase in power is required to combat a 10 mph headwind (velocity ratio of 1) for a 70 kg male Navy Seal cycling at 10 mph (4.4704 m/sec)? 

Here's how to solve this question. Looking at the figures above, the corresponding numbers for his weight are:

A = 253 W (power due to grade)
B =  15 W (power due to rolling resistance)
C = 0.14 m2
Corresponding correction factor for his weight is ~0.047.
Kp = C.Vg 3p = 0.14(4.47043).1.06 = 13.25 kg.m2s-3

Solving using the equations shown earlier in the post,
   
 % increase in power= [(2)2-1].[0.047]~ 0.141 (14.1%)
 increase in absolute power= 0.141(253+15+13.25)~ 40W
 increase in power to weight ratio = 40/70 = 0.57 W/kg


Similarly, we can quantify how much extra boost one would need per kilogram of body weight for different velocity ratios. 

Here's a case scenario for a Tour de France contender on the Tourmalet :
Weight = 65 kg
Height = 1.78m
Power to weight 6 W/kg riding
Desired speed = 10mph.

The plots are shown below : 

 FIG 6 : The operating zone of a Tour contender can, for example, be 6.0 W/kg. This example is for a rider weighing 65 kg. Other parameters assumed are shown in red. In an ideal case, the rider traces a straight horizontal line on the 0 point (y-axis) when there's no wind. Any additional wind will force him to trace horizontal lines as he pushes his body harder. Horizontal trace will move vertically up on the plot with wind change.

The above plot perhaps proves why it pays to prepare the extra mile for July. If 6.4 Watts/kg is what a person needs to win the Tour, perhaps only 6.2 is really needed. The additional 0.2 W/kg is used as insurance, against attacks, accelerations and misfortune winds. Very rarely are riders gifted as such to keep doing this over the course of 3 weeks.

Note : You could also have a tailwind of similar proportions, except that now the (1+ Vw/Vg) term is modified to (1- Vw/Vg). A tailwind of the same proportion as your forward velocity means 1-1 = 0 which multiplied to K effectively cancels your need to combat any wind. It is free speed which you can devote to the terms A and B.  The funny part is that a tailwind never gives you back the "same amount" of speed as the headwind will take away from you. Its a law of nature.


PART 2 : Power Variation With Density Change As Velocity Ratio Remains Constant

Previously, we looked at change in power to weight ratio with change in wind speed. 


Fact of the matter is, air density does change appreciably with altitude as you ascend.  So this term varies with density as climbing progresses :
Term = K.p.(1+ Vw/Vg )2

where K is defined to be K = C.Vg 3 

The Standard Atmosphere chart, which I pulled out of a book and approximated by a polynomial fit in Excel, tells me the following :

1) At an altitude of 500m (1640 ft), the density is 95% of what it is at sea level. That's a 5% decrease.
2) At an altitude of 1000m (3281 ft), density has decreased by 9.2%. 
3) At an altitude of 1500m (4921 ft), density has decreased by 13.5%. 
4) At an altitude of 2000m (6562ft) , density is now only 82% of its sea level value, a decrease of 18%.


Air density is gently geometrical for the first 1 or 2 miles of the earth's atmosphere. Here is how it behaves :


Like before, I derive the % decrease in power requirements due to altitude with zero headwind (Vw/Vg=0). Let L be the amount representing % of sea level density at any given altitude. If po is sea level density,

 % decrease in power =
[1- (L/100)] / [1+ (A+B)/(Kpo(1+Vw/Vg)2 ]

The effect altitude and hence air density has on relieving a rider is very gently geometrical, and not linear. This is proven below. The linear trend-line as you can see doesn't fit 100%.

FIG 7: The number on the y-axis shows how much power to weight ratio one can potentially save while climbing at higher altitude. This is because the higher the altitude, the lesser is the pressure and density of air. This is also why World Hour Record attemps are often done in stadiums that are located high above sea level. Beyond 2500 m ofcourse, advantages in power savings are countered by the thinning of the air. 

FIG 8 :  This diagram simply shows to what degree headwinds and air density contribute to power requirements.


Part 3 : Conclusion & Validation

If wind conditions changed as climbing progresses, density decreases. Whereas wind exponentially increases the power requirements, the density moderately decreases it since you require lesser effort to propel in a less dense medium. But wind is the biggest power soaker.

Here is an interesting chart showing the effects of wind on power to weight ratio given finishing times for Alpe d'Huez. This legendary climb is much more shorter and steeper than Tourmalet but located at lower altitude. It was compiled by Alex Simmons, a cycling coach from Australia.  Perhaps my charts can supplement his or vice versa? It is really well made. 


Simmons' plot can be a sanity check in that power to weight ratio needed with wind on Alpe d'Huez closely correspond with mine for the Tourmalet. I must however add that I have not considered the losses due to drivetrain in my model. For example, a +2.5 mph headwind is a 0.25 velocity ratio. Corresponding additional power to weight ratio (Fig 6) is about 0.13 W/kg from the no wind condition. Assuming a bike is 95% efficient, 0.13/0.95 = 0.14 W/kg. This is my required increase.

Simmons' model for the steeper Alpe d'Huez, on the other hand, says that it should be +0.5 W/kg.  Is this +0.5 W/kg an overestimation, considering that a 2.5 mph wind is classified as just "Light Air" in the Beufort Wind Scale?

If 70 kg rider is producing 6W/kg, he is riding at 420 Watts. A +0.5 W/kg increase means he has to propel himself now at 455 Watts! Phew!

I'm not surprised it is higher than mine since the grade is steeper and my rider weight is 65 kg, although my choice for bike weight is same as his. Also, an important thing to note is that Alpe d'Huez is at lower altitude than the Tourmalet. Hence, it is more than likely that a rider has to put forth more watts on the Alpe than on the Tourmalet. Remember the mildly geometrical reduction effect of density decrease?

Another interesting bit to notice also from the plot above is that a cyclist climbing Alpe d'Huez doesn't get back the same relief from power to weight ratio with a tailwind as the extra amount he has to spend in a headwind. Its funny how that works. Its like climbing hills. You don't get back the time you spent going uphill by going fast downhill.

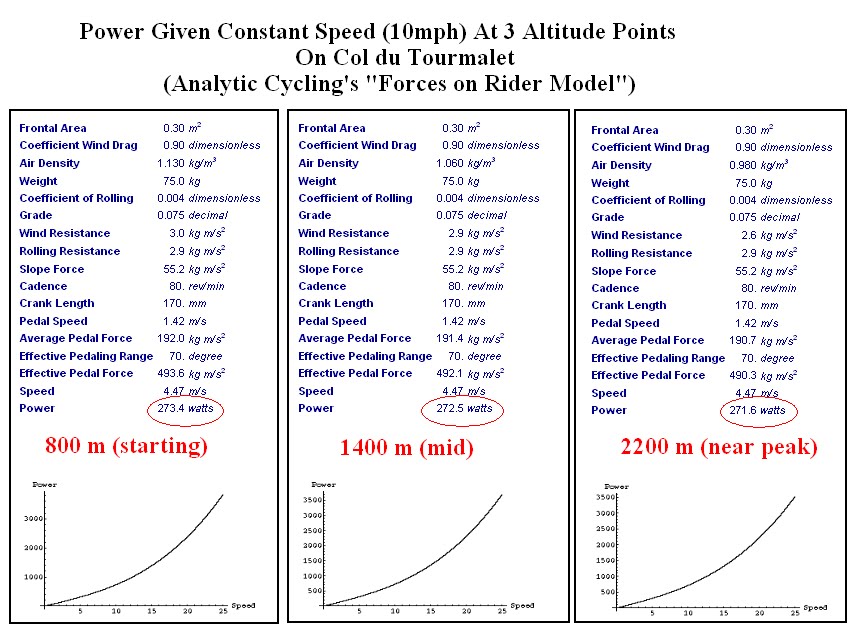
How about verification of the altitude's effect? First, Analytic Cycling's "Forces on Rider" model shows the following power requirements at the bottom, mid point, and top of Tourmalet. Speed was kept constant at 10 mph and all other parameters were made to match my choices before.


You can notice a 1 Watt power demand reduction just by riding from the bottom of the Tourmalet to approximately its midpoint (a 600m elevation change). Not much really in the overall scheme of things since that's a 1W/65kg = 0.003 W/kg decrease. My model (Fig 7) says 0.016 W/kg is the reduction so they're pretty close. From 1400 to 2200m, the reduction is again 1 W, or 0.003 W/kg for the Tom's model. My model says 0.02 W/kg.

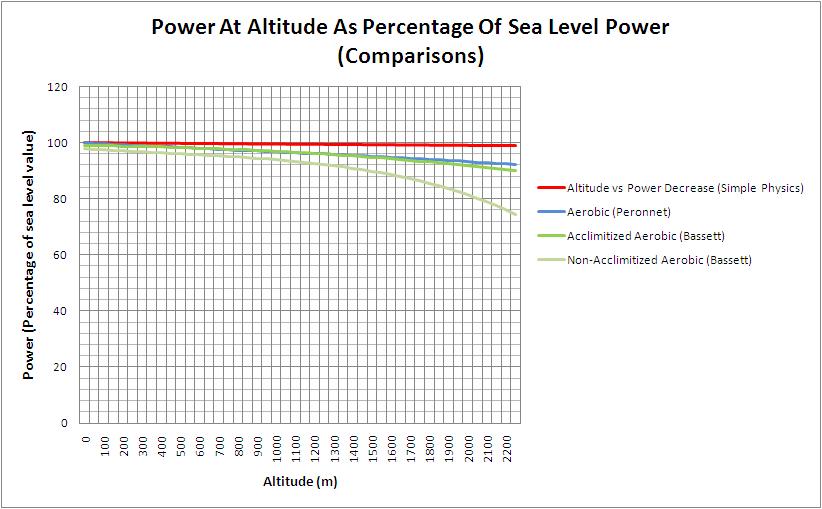
Secondly, although data is severely lacking with regards to the effect of altitude on power to weight ratio, a couple of other researchers in the exercise physiology field looked at how aerobic power varied  for 4 groups of runners, not cyclists. They estimated that aerobic power as a percentage of that at sea level, signified by "y", drops off wrt to elevation by the following relationship :


Below, I have plotted those 3 estimations along with mine (65 kg rider producing 6W/kg) upto an altitude of 2200m (the max height of the Tourmalet).


What we see above is apples and oranges. Mine calculates the relief in effort to maintain the same speed due to decrease in altitude density while the others have calculated the decline in power output due to a decline in VO2 max output. They really don't co-relate, do they (advantage vs degradation) ? But is it fair to say that the net effect of both of these phenomena is a curve in-between them?


I must conclude by stating that Alex's theoretical calculations for the wind effect matches closely with mine but this is not the same case for the altitude effect (see above). However, it remains to be said that all our numbers remain to be validated from real powermeter data and CFD simulations for cycling. I'm curious to see how both wind, and high altitude, affect a cyclist in the real world and I'll bet the changes are highly non-linear in nature.  Discussions ongoing at Cycling Forums.

*  *  *