The following, divided into 3 parts, is a simple physics exploration of wind and altitude's independent effects on power to weight ratio, a subject that has not been treated by any cycling book so far. Independent effects are important to understand in order to get a feel for how they affect power to weight ratio when acting in combination. The climb chosen is the famous Col du Tourmalet which is featured in this year's Tour. Assumptions in the analysis, for simplicity, include constant speed, constant grade and a formula for frontal area developed by Bassett & Kyle. Validation is done against calculations done by Alex Simmons (see conclusions) for wind vs power to wt results. Power models from Tom Compton's "Analytic Cycling" site and data from prominent researchers are compared with for altitude vs power results.

We have explored VAM calculations here and here, However, climbing rate by itself does not provide an understanding of the effect of transient wind and altitude on performance. The wind and altitude can make a big difference. On the other hand, one could also argue that the effect of switch-backs and spectators along the road may effectively cancel out the contributions from head and tail winds. I'm not sure how much that contributes but that can be a topic in the comments section.
The equation explored in a previous post to understand climbing rate explored only the power needed to increase a rider's potential energy. Lets call this A. If W is total weight of bike and rider in Newtons, Vg ground speed in m/sec :
While this is a big piece of the power pie for climbing, there are couple of other elements to the power equation. One deals with rolling resistance at low speeds. Let's call that B. If Crr is the co-efficient of rolling resistance (typically 0.004 or so for a 100psi tire)
Both A and B are constant if grade and ground velocity are steady.
There's a third element that comes to play which is the effect of wind and density. We can call it C. This is composed of frontal area A and associated drag force. If Cd is the co-efficient of drag (0.9 typical for cyclist on hoods) and this multiplied with area gives drag area, then :
Say very little change happens with the cyclists' drag area (Cd.A where Cd is coefficient of drag and A = area), velocity V and say, density altitude is fixed as p. Let's also assume speed to be steady and gradient of slope to be an average. If Vw is the wind speed (negative for tailwind) and Vg the ground speed, then not accounting for the tiny drive-train losses in your super efficient bicycle, the power to climb will then be a function of relative velocity as follows :
Let's work with just the third term, calling it Term. Its interesting to see what happens when you normalize Term by the the cyclist's ground speed on the climb. Dividing and multiplying throughout by Vg to change its form but preserve its meaning, we get :
=> K.p.(1+ Vw/Vg )2
where K is defined to be K = C.Vg 3
Vw/Vg is called velocity ratio. Now you can see that when there is no headwind, Vw/Vg =0 and power becomes a function of K and p only.
Let's look at how that wind term varies with a change in velocity ratio. The density of the air on Tourmalet is kept uniform for this exercise, at a value of 1.06 kg/m3
When a headwind picks up, the velocity ratio increases from its baseline of 0. The following geometric growth is seen in Term :
- -When headwind is 1/10th of cyclist's forward velocity, Term is an extra 21% compared to no wind condition.
- -When headwind is 1/4th of cyclist's forward velocity, Term is an extra 56% from no wind condition.
- -Similarly, when it is half of cyclist's forward velocity, Term is an extra 125% from no wind condition and you must supply 44% more power from case 3).
- -At an extreme case (assuming you're traveling atleast faster than 5mph), (1+ Vw/Vg) could be highest when the headwind is same as your forward velocity. When that happens, 1+1 = 2 and 2 raised to itself = 4 meaning that all things kept constant, Term is more than 4 times its original value, a 300% increase.
Or generally, if all other things are kept the same,
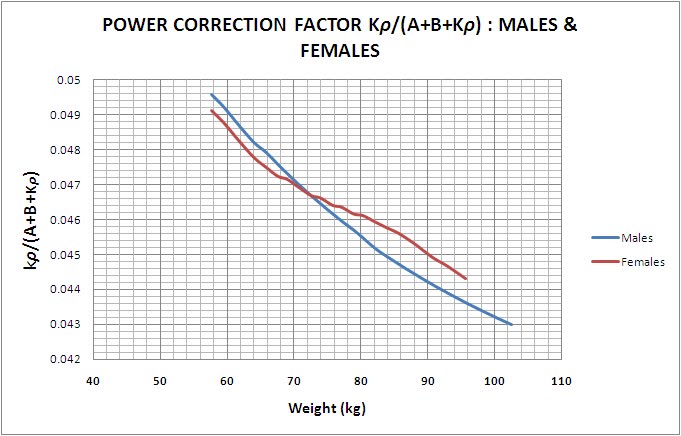
We know how to calculate the first part. The second term, Kp/(A+B+Kp) can be called the Correction Factor. Once this puzzle is solved, we can solve for the proper required increase in power.
Without going into too many details, here are graphs I produced. Maximum height and weight were extracted from the Navy Seals' website. These are some of the fittest people in the world and they were a good choice because it makes no sense to work with data of unhealthy, overweight people. (Note, their dimensions are not like Tour contending emaciated cyclists but it should be close). Frontal area was then calculated using Bassett and colleague's formula that was retweeted by Jonathan Vaughters. The speed is kept constant at 10mph. p is kept constant at the average of 1.06 kg/m3. The gradient was uniform at 7.5%, with no change.


Here's how to solve this question. Looking at the figures above, the corresponding numbers for his weight are:
A = 253 W (power due to grade)
B = 15 W (power due to rolling resistance)
C = 0.14 m2
Corresponding correction factor for his weight is ~0.047.
Kp = C.Vg 3p = 0.14(4.47043).1.06 = 13.25 kg.m2s-3
Solving using the equations shown earlier in the post,
increase in absolute power= 0.141(253+15+13.25)~ 40W
increase in power to weight ratio = 40/70 = 0.57 W/kg
Similarly, we can quantify how much extra boost one would need per kilogram of body weight for different velocity ratios.
Here's a case scenario for a Tour de France contender on the Tourmalet :
Weight = 65 kg
Height = 1.78m
Power to weight 6 W/kg riding
Desired speed = 10mph.
The plots are shown below :

Note : You could also have a tailwind of similar proportions, except that now the (1+ Vw/Vg) term is modified to (1- Vw/Vg). A tailwind of the same proportion as your forward velocity means 1-1 = 0 which multiplied to K effectively cancels your need to combat any wind. It is free speed which you can devote to the terms A and B. The funny part is that a tailwind never gives you back the "same amount" of speed as the headwind will take away from you. Its a law of nature.
Previously, we looked at change in power to weight ratio with change in wind speed.
Fact of the matter is, air density does change appreciably with altitude as you ascend. So this term varies with density as climbing progresses :
The Standard Atmosphere chart, which I pulled out of a book and approximated by a polynomial fit in Excel, tells me the following :
1) At an altitude of 500m (1640 ft), the density is 95% of what it is at sea level. That's a 5% decrease.
2) At an altitude of 1000m (3281 ft), density has decreased by 9.2%.
3) At an altitude of 1500m (4921 ft), density has decreased by 13.5%.
4) At an altitude of 2000m (6562ft) , density is now only 82% of its sea level value, a decrease of 18%.
Air density is gently geometrical for the first 1 or 2 miles of the earth's atmosphere. Here is how it behaves :

Like before, I derive the % decrease in power requirements due to altitude with zero headwind (Vw/Vg=0). Let L be the amount representing % of sea level density at any given altitude. If po is sea level density,
The effect altitude and hence air density has on relieving a rider is very gently geometrical, and not linear. This is proven below. The linear trend-line as you can see doesn't fit 100%.


If wind conditions changed as climbing progresses, density decreases. Whereas wind exponentially increases the power requirements, the density moderately decreases it since you require lesser effort to propel in a less dense medium. But wind is the biggest power soaker.
Here is an interesting chart showing the effects of wind on power to weight ratio given finishing times for Alpe d'Huez. This legendary climb is much more shorter and steeper than Tourmalet but located at lower altitude. It was compiled by Alex Simmons, a cycling coach from Australia. Perhaps my charts can supplement his or vice versa? It is really well made.

Simmons' plot can be a sanity check in that power to weight ratio needed with wind on Alpe d'Huez closely correspond with mine for the Tourmalet. I must however add that I have not considered the losses due to drivetrain in my model. For example, a +2.5 mph headwind is a 0.25 velocity ratio. Corresponding additional power to weight ratio (Fig 6) is about 0.13 W/kg from the no wind condition. Assuming a bike is 95% efficient, 0.13/0.95 = 0.14 W/kg. This is my required increase.
Simmons' model for the steeper Alpe d'Huez, on the other hand, says that it should be +0.5 W/kg. Is this +0.5 W/kg an overestimation, considering that a 2.5 mph wind is classified as just "Light Air" in the Beufort Wind Scale?
If 70 kg rider is producing 6W/kg, he is riding at 420 Watts. A +0.5 W/kg increase means he has to propel himself now at 455 Watts! Phew!
I'm not surprised it is higher than mine since the grade is steeper and my rider weight is 65 kg, although my choice for bike weight is same as his. Also, an important thing to note is that Alpe d'Huez is at lower altitude than the Tourmalet. Hence, it is more than likely that a rider has to put forth more watts on the Alpe than on the Tourmalet. Remember the mildly geometrical reduction effect of density decrease?
Another interesting bit to notice also from the plot above is that a cyclist climbing Alpe d'Huez doesn't get back the same relief from power to weight ratio with a tailwind as the extra amount he has to spend in a headwind. Its funny how that works. Its like climbing hills. You don't get back the time you spent going uphill by going fast downhill.
How about verification of the altitude's effect? First, Analytic Cycling's "Forces on Rider" model shows the following power requirements at the bottom, mid point, and top of Tourmalet. Speed was kept constant at 10 mph and all other parameters were made to match my choices before.

You can notice a 1 Watt power demand reduction just by riding from the bottom of the Tourmalet to approximately its midpoint (a 600m elevation change). Not much really in the overall scheme of things since that's a 1W/65kg = 0.003 W/kg decrease. My model (Fig 7) says 0.016 W/kg is the reduction so they're pretty close. From 1400 to 2200m, the reduction is again 1 W, or 0.003 W/kg for the Tom's model. My model says 0.02 W/kg.
Secondly, although data is severely lacking with regards to the effect of altitude on power to weight ratio, a couple of other researchers in the exercise physiology field looked at how aerobic power varied for 4 groups of runners, not cyclists. They estimated that aerobic power as a percentage of that at sea level, signified by "y", drops off wrt to elevation by the following relationship :

Below, I have plotted those 3 estimations along with mine (65 kg rider producing 6W/kg) upto an altitude of 2200m (the max height of the Tourmalet).

What we see above is apples and oranges. Mine calculates the relief in effort to maintain the same speed due to decrease in altitude density while the others have calculated the decline in power output due to a decline in VO2 max output. They really don't co-relate, do they (advantage vs degradation) ? But is it fair to say that the net effect of both of these phenomena is a curve in-between them?
I must conclude by stating that Alex's theoretical calculations for the wind effect matches closely with mine but this is not the same case for the altitude effect (see above). However, it remains to be said that all our numbers remain to be validated from real powermeter data and CFD simulations for cycling. I'm curious to see how both wind, and high altitude, affect a cyclist in the real world and I'll bet the changes are highly non-linear in nature. Discussions ongoing at Cycling Forums.


This was a very interesting post! However, I must note an error in the section "Power Variation With Velocity Ratio Change Keeping Density Constant". The increase of required power due to wind variations only affect the third term of the sum A + B + C.p.(Vg + Vw)^2. (i.e., C.p.(Vg + Vw)^2). Therefore the percentage increase in the factor (1+Vw/Vg) will only affect this term and not the whole sum. Taking your example of P=200W, we can assume that most of this power will be needed for the first two terms A and B (lets say A+B=150W). The 300% increase only applies to the wind drag term, so the required increase is from 50W to 200W. The total power required is then 350W and not 800W as you mention. Of course, it will always be an increase, but not as strong as you mention.
ReplyDeleteThanks for all the great articles!
Excellent post! What about wind effect on cooling? I would actually love it if someone could fan me while I climb for 2 whole hours. Would make me want to go faster I think?
ReplyDeleteThere is a bigger factor at play caused by altitude than resistance: oxygen.
ReplyDeleteEffectively your lactate treshold is reached much sooner. To me, that's what I always find myself battling before I ever think of wind. I don't know what the facts are about the number of oxygen-bodies in some measure of mass-of-air as compared to ground level (I'm Dutch, everything is ground-level here), perhaps that's insignificant, but at least it always feels as the most limiting factor as you cannot anticipate (one way or the other) - whereas you can sense wind.
@P : Pardon me if I'm wrong but I think hypoxia sets in only beyond 7000 feet and so I only considered cases to about 2000m. Adaptation also has a big role to play dealing with altitude I believe. Those obscure Tibetans can live up there with no problems, so can Ethiopians. The World Hour records were mostly all broken at altitude. You're right that oxygen is low hence VO2 max decreases but I think the aerodynamic advantages of high altitude, particularly that associated with low drag and density, is better for overall performance. They say you're 4-5% faster up there than down here.
ReplyDeleteVictor : Thanks for chiming in. I thought about that and looks like I overcooked that! FAIL!
ReplyDeleteI must say :
A is simply W x V x sin (arctan Grade)
B is simply W x V x Crr1 (cos (arctan Grade))
Crr1 is rolling resistance
W = weight
V = ground velocity
Since I went on to assume that the cyclist pedals in a steady fashion with no accelerations, V is constant and so A and B are constant in turn. Which means most if not all of the power soak happens to the third term and and since that term is parabolic, it increases very fast.
But still you're right, it shouldn't increase by 300%, infact only by [ 300 x Kp/(A + B) ]%. I'll have to change this.
Nice post, but there's nothing "exponential" about your equations: the graphic is misleading.
ReplyDeleteI often hear the term "power increases exponentially..." Exponential should instead be replaced with "geometrically", or at least "superlinearly".
FYI : This has been edited.
ReplyDelete@Paul: you've got a point, but of course only on hot days. I once cycled from Capestrano to the Gran Sasso in Italy on a very hot day (42 degs at Capestrano). On the 8% climb, I managed to do 9.5km/h with a tail wind, and 12km/h with a head wind, the difference due to being able to loose heat more effectively in the head wind...
ReplyDeleteIt would be really hard to put this into equations and formulae, though...
Arjan : That is a bit interesting. I think there has to be a point where the wind stops benefitting you (in terms of cooling it provides) and works against you more. Do you remember the wind speed that day?
ReplyDeleteAmazing stuff. Dr. Ferrari would be proud of you :)
ReplyDeleteGreat posting ROn! Its frickin remarkable how you are able to take the brute force attempt at understanding the complicated physics of our sport. I'm a loser at this end , I suppose thats why I have my power meter and love it. :\
ReplyDeleteJoanne : Power meter does not describe any of the things I or Simmons have explored, although you could validate this by looking into the powermeter data of any rider venturing out on the mountains. As far as I know, no one has experimented with riding in a known headwind while climbing and seeing its effect on power to weight ratio.
ReplyDeleteTo others, if you're interested on another mathematical treatment of wind by engineer Dan Conelly (Djconnel above) check out this post on his blog. http://djconnel.blogspot.com/2009/11/effect-of-wind-and-bike-speed.html
Thanks for posting the link to my blog!
ReplyDeleteOn the height and weight effect on frontal area: if you assume mass is proportional to height × weight × depth, and height² is proportional to mass (constant BMI), and you assume depth is proportional to width, and that area is proportional to height × width, then you trivially get that cross-sectional area is proportional to mass³/⁴. Or, if you want to toss in height (no constant BMI assumption) you get area proportional to (height × mass)¹/². These are body only, so need to be diluted with a term accounting for the bike. It's interesting to compare this simple approximation with the Bassett & Kyle formula, which is empirical.
@Ron: I don't remember the wind speed, but I do remember it being turbulent. I should be able to find out the exact date, and with a bit of luck I can google what the weather was at that date and place.
ReplyDeleteArjan : Wow, let me know if you're able to do that. It would be a great service if a weather site would hold past temperature and wind info in its archives.
ReplyDeleteAntoine Vayer, a cycling coach in France, calculated L.A produced a staggering 6.97 W/kg on Alpe d'Huez in 2004 (using powermeter data?). Going by Simmons' graph, if he was not doping (a big assumption) there must have been a headwind greater than 2.5 mph that day?
ReplyDeleteDan,
ReplyDeleteRegarding Bassett's frontal area formula, I was told by Dr. Andrew Coggan that this is not ideal. First, it based upon only a handful of subjects, and second, it is for riders in the aero position, not sitting up and/or standing while climbing on a road bike. He recommended that better choices would be contained in these papers (which I cannot spend money on to buy at this point) :
http://www.ncbi.nlm.nih.gov/pubmed/19199206
or
http://www.ncbi.nlm.nih.gov/pubmed/12355191
Its interesting that despite using the formula, I obtained only minor variations from Simmons' and Compton.
Regarding headwind as cooling, surely you could replicate conditions for testing on a static trainer with various fan levels approximating wind speed (none, light, strong) and compare with power output and "overheatedness"?
ReplyDeleteEveryone is different of course, but it would be interesting to know that sweet spot of diminishing returns where a headwind goes from useful cooling effect to a hindrance to one's speed. Obviously this would depend on ambient air temperature and other factors.
From an anecdotal side, I know I tend to work a lot harder in a headwind when it's cold outside. :)
@Ron: the date was August 6, 2008, and the temperature at an airport some 80 km away (but as far as I know had comparable weather) was 34 degs, with a wind speed of around 20 km/h, so that'd be Beaufort 3-4.
ReplyDeleteIt would also be interesting to know how much you'd have to cut back on power in case you're overheating.
One of the issues with comparing power meter data to a model is that the model assumptions need a true wind vector (at rider level) the whole way, which can be (often is) highly variable. A lower order effect is that wind yaw angle can also impact a rider's CdA.
ReplyDeleteThe main point of my post/chart was simply to say that pinning down a W/kg number from ascent times has quite a sizable error range since not all input assumptions can be known.
You might take wind info from weather reports but wind at actual rider level is usually different and significantly affected by local terrain/obstacles.
There is of course some work underway to address this issue, with some pretty cool sensors being developed by Andy Froncioni:
http://andyfroncioni.com/2010/03/the-chung-on-a-stick-project/
It's mainly been developed for TT applications but there are other ways the data could be used.
Note I said wind speeds at rider level. Weather station reported wind speeds are rarely at rider level.
ReplyDeleteAs I started out writing (see first para), I was hoping that people would discuss the flow of wind around trees, spectators, switchbacks etc.
ReplyDeleteIn short, all the wind tunnel testing and theoretical models are pretty much estimations for a clear road with wind speeds not at the rider level. Question is, how much of a difference? You said the difference is significant? This "Chung-on-stick" device would be handy if it can quantify that difference. I come from the engineering background and as far as I'm concerned, making reasonable assumptions are more than valid for calculation. What we also really need is a CFD simulation of wind around obstacles in the rider's environment. Any idea if any research at that level is being performed by a party? Thanks Alex.
Thanks a lot for elucidating the mechanics of wind.
ReplyDeleteThanx for the post.... interesting.. im building generators using a 55bhp and 96bhp diesel engines.... which site to visit. help..
ReplyDelete