Monday, August 31, 2009

13 The Fun & Modern Day Magic Of Bike Advertising

That bicycle companies will go to odd lengths to market their products is clear when you pick up their catalogs and flip through their pages. If you manage not to drool all over yourself and drown in your own puddle, you may come across some odd nevertheless interesting finds.

The word cheesy in the urban dictionary means "shoddy quality". And I think when you devise cheesy marketing and drive it towards someone and his pocket while trying to attracting their interest, its sort of like shining a bright flash of immodest light in someone's face, ordering them to go blind and start believing through faith alone.

Perhaps immodesty is the norm these days? I don't know. But I wonder what space aliens might think of us when they arrive at our desolate planet many years later and excavate our sorry remains. All those piles of papyrus junk containing cheesy advertising might put them off. They'll probably just fly back in their space ships disgusted.

Today's case in point for illustration :

(Drumroll...)

Enter the Zipp Annual Product Catalog for 1993. I had this saved on my computer from sometime back and I doubt you can get this on the internet now.

Anyway, this piece of advertisement was a specimen alright. Open page 1 and you unmistakeably find yourself at the center of what they're trying to sell, an odd looking bike with bright red and yellow that does prove that red color has the marketing power of provoking emotional outbursts; repulsion could certainly be one of them?


And why, there's a quote on top of the prologue that asks the reader that he stop for a little more insight into this contraption. What might it be and will it inject him with some wisdom before his adventure?

It reads :

"Any sufficiently advanced technology is indistinguishable from magic" - Arthur C. Clarke

Of course, the great futurist and sci-fi author never said any such thing about a bicycle. It may have been hip in those days to quote Clarke anywhere and everywhere you found a spot begging for scientific blessing.

The quote is the third law in what is known as Clarke's Laws, provocative observations on the future of science and society that were published in his book “Profiles of the Future". The essays in the book covered a wide range of topics looking to as far as year 2100, exploring the conquering of gravity, conquering of time and space and so on and so forth. I wonder how an emasculated bike for half naked tri geeks connects with Clarke's imagery. It might have been the carbon fiber in the bike. It sounds space age.

Anyway, as we move on, we find more red and more yellow with blue and orange along with fancy graphs attached to unvalidated bursts of insight such as "our Zipp bike lets you save 19% of your energy at 30mph compared to competitor's frames." and how treating yourself to their "Ballistic Hubs" and "V-Rim" Technology" will never make you regret it, ever!

A question "what is there to think about?" adorns the end of that page, shooting the reader in the face for entertaining naughty contradicting thoughts and pulling him along for the rest of the thrill ride.

What is there to think about? Its basically just "Blazingly Fast"!

The next page is a full page motion blur image of a person riding on such a bike, almost like he's doing a 180 in a school zone. It seems to fly right past the reader and out of the page. That must surely captivate him. Wow, that is fast.

P.S : Photo editing sure works, but it must have been so bad those days that this rider in the blur came out to look more like Daffy Duck with a silly hat on than anything human.


Page 5 has another quote, another inkling of wisdom from great people :

"Those who create are rare; those who cannot are numerous." - Coco Chanel

Coco Chanel was talking about the fashion business and the creation of simple and elegant clothing for women. She quite possibly didn't give a French kiss about bicycles. But Zipp, perhaps to show how they both agree with each other's ideologies, throw in a picture of a track bike in a purple color so repulsive, perhaps the men at Zipp were taking their revenge out on the more fairer of sexes back home for nagging them so much.


Some near naked images of men show up in the following pages and then lo and behold, we are greeted with another quote, this time from none other than the late Prime Minister of India - Mrs Indira Gandhi. It is robust with grammatical error.


"My grandfather once told me that there was two kinds of people : those who do the work and those who take the credit. He told me to try to be in the first group; there was less competition there." - Indira Gandhi

Mrs. Gandhi was talking about the economic wisdom offered to her by her grandfather in a British India. If using Arthur Clarke to bless your bike was hip, quoting world leaders out of context with grammatical error while denigrating them between two near naked tri geeks was probably even hipper...or hippier.

But that's not all. After 11 truly entertaining pages of marketing, Zipp finally zips their campaign with one more imagery.

This is to suggest to us that they're winning the world over right from little Indiana.


A casual observer might see it as a harmless image. "What's wrong with that?"

Well, it would have been perfectly sane if it weren't for a final closer look at that odd flag at the 6 o'clock position. Let's magnify it some 200%.


What's this?!!

Why Ron, I've never seen anything like it before. Could it be the imaginary empire of Kuboojistan, told in tales by past house wives...that empire so mighty that their armies raped and looted other nations and had their flags miniaturized and sewn into theirs?

Or did the bleary eyed guy with the photo editor, late in the day, run out of space to place more flags of the world? Perhaps on finding that the coffee in the pot ran out, did he decide to call it a day and rush home after patching all the remaining flags together to form the mighty Kuboojistan?

I don't know. I maybe ignorant. But after this exciting exercise of swimming through a bicycle catalog risking being eaten alive, a reader could be forced to reflect upon the 3rd Arthur Clarke's Law :

Any sufficiently advanced technology is indistinguishable from magic, indeed.

Except, the magic is not so much in the bike.


* * *


Do you have recollections of cheesiness in bicycle product ads? Write to me here. Let's laugh together and be merry.


Friday, August 28, 2009

43 The "Dominant Left Theory" In Bicycling Crashes

This blog brings you new perspectives and interesting ideas in cycling, without any charge. You may pay me back through your continued interest.

Some months back while visiting a good friend of mine, I happened to grab a vintage cycling book off his shelf and flip across its pages. I like the smell of old books. Its like battery acid for the mind of a book enthusiast, just stimulating. In one of its uneventful pages simply titled Appendix, I came across the following words. Read carefully, as the author comes across as completely assured of what he's about to theorize. I'll tell you who wrote this at the end of the quote.

"If you been riding long enough to have some falls, I'll bet that almost every injury has been on the left side of your body. How do I know this? Because its the same for me and many other riders. If you want to find an old bike racer, look for a guy with scars on his left elbow. There seems to be a physiological reason for this and it is very interesting, though it hasn't been formally documented as far as I know. It has to do with the location of the heart, the body's primary organ.

As we know, the heart is to the left of the center in the chest. When the body loses equilibrium, it has a strong tendency to fall toward the heart side. This also explains why most riders find it easier to corner to the left than to the right. And it's why track races go counterclockwise so that all turning is to the left. The reason it feels more natural is that the distance from the heart to the ground is less when turning left than when turning right. Even though track riders often do fall on their right side, this doesn't disprove the theory. It just points out the bike's tendency to slide down the banking.

Cozy Beehive edition of original illustration by Grid Designs

What is the practical value of all this? For one thing it means you may need more practice cornering to the right before it feels as natural as cornering to the left. It may also be wise to wear a protective pad on your left elbow in criteriums, especially if you've injured it before. Should you crash there is a better than even chance you'll land on it again. Keep this "left side" theory in mind and you may find other ways to use it for your benefit. "

The author of those words, documented in the 1985 classic Bicycle Road Racing, was none other than the Polish coach, Eddie B (also known as the father of modern American cycling). Being one of the most respected coaches in history, you'd think he'd make sense with his ideas.

This one is particularly interesting as he's stating that "almost every" injury is to the left side of the body because the body (if you consider it to be an inverted pendulum while on a bike) has a directional falling bias. It is also stated that because this "falling" is easier to the left than the right, cornering towards the left side is as well. Therefore, velodromes are run anticlockwise.

Today, you readers can be fellow mythbusters. I did my part, analyzing some 10-15 real world videos of bicycle crashes. I found no correlations with the statement above and all crashes highly depended on riding conditions. I also counted all my scars and there are more to the right side than the left. I don't believe gravity has a preference for this side or that side.....unless you can take a fresh cadaver, cut the flesh into two equal halves and find out that one side weighs more than the other. Are any of you active in criminal investigations? This whole thing begs me to ask : what side is a dead body more likely to fall towards? (If you have murdered someone, are in jail and use an iPhone to read my blog, let me know....)

So today's question : Is there biologically any reason behind the supposed tendencies to fall towards the left side, or is it just a subconscious reflex action to protect your derailleur and chainring from getting damaged? Ah. Think about that one for the weekend.


ADDITIONAL READING :

We Might As Well Crash

* * *

Tuesday, August 25, 2009

17 Dynamic Ride Comfort & Measuring Vibration In Bicycles

The concept of ride comfort varies from person to person. If one were to ask 10 different people about a particular bike's ride characteristics, its likely they'll say 10 different things. There's probably a good reason for this. Physiologically, we can sense pain better than comfort because our bodies have lots of pain receptors (nociceptors) but there's little evidence of a comfort receptor. So our bodies are built without 'signal probes' for comfort. Therefore we tend to call something comfortable if there's no discomfort, i.e, if our nociception does not pick up discomfort signals. (If there's a more involved perception mechanism than what I've described, its outside the scope of this blog)

But even the perception of discomfort varies from person to person. A seasoned veteran testing out a bike is likely to have a different perception of discomfort on a given bike than a beginner may. Bicycle marketing literature as well as reviews of bikes usually are plentiful in these sort of subjective feelings that no one can put a number upon. X person tests the bike. He likes it. Finally, he places some arbitrary golden stars as rating against the bike in a magazine. What does the reader feel?

You'd want to snap - "Who cares about small numbers, just believe it and ride it!". Yeah, that's alright. But as bicycles get more expensive and new inventions border on that which is ridiculous, when bold claims ask for a lot of money in exchange, a customer would surely not mind knowing if there's true value in these claims or if there's some sort of daylight robbery going on.

Zertz - A marketed viscoelastic insert for reducing vibration. It comes standard on many of Specialized bicycles and cannot be removed or replaced.


One of those claims involve the relation of bicycle design with vibration reduction. For example, some years back, we saw Specialized incorporating an elastomer insert into their bikes at specific locations that supposedly "soaked up" the road chatter. Others have marketed frames and forks with special, curvy shapes that implied they're somehow better at vibration reduction, power transfer etc etc. Note that there is zero published technical evidence backing up the claims, yet people are quick to side with one brand or the other because of personal feelings.


This picture shows the harmonic tuned mass damper marketed by Bontrager as the Buzzkill Damper. This particular one was seen at times on Stuart O'Grady's bikes at the Paris-Roubaix. More on this can be found here.


One of the recent examples is Museeuw's biocomposite bike, a medley of organic flax and carbon fiber made in Belgium through a patented process that I've written about in the past. Their marketing strategy seems to be to make people believe that there's something really magical about its vibration dampening characteristics compared to competitor's bikes. Interestingly, they have joined hands with the materials engineering department at the University of Ghent in a partnership to do the R&D work. Apparently, one of the deliverables from the University would be an objective study of the bike's vibration dampening characteristics so that they can be presented to customers with commercial interests.

Recently, the 3D plot you see below was leaked out to the public on the internet after a Museeuw press launch. How it got leaked is a story you need not worry about. Anyway, the plot came directly out of one of the studies on the flax-carbon bike done by an individual named David Luyckx.

Fig 1 : This plot shows Damping Percentage vs Vibration Frequency vs Time for a Museeuw MF5, measured using two accelerometers mounted on the bicycle. Vibration frequency is a function of mass of the vibrating body, here, the bicycle and rider. Little is known to us about the test equipment and instrument characteristics of the accelerometers used.


He then compared it to the characteristics of 3 other bikes tested in the same study :


Fig 2 : This plot shows a comparison of vibration dampening of a (left to right) Pinarello Prince, Willier Cento Uno, Cervelo R3SL and the MF5


Now in the automobile and motorcycle industry, there are some specific ISO standards you have to follow to measure dynamic comfort and whole body vibration while sitting in a vehicle. None, as far as I know, exist that describe what to do incase of a bicycle. So David Luyckx set out to design his own experiment.

After reading his brief test report to us at rec.bicycles.tech, the following things can be said about the nature of his ideas and his experimental setup :

What To Measure : Ride comfort while using the flax-carbon bike, by studying trends in vibration dampening in the same (histeretic dampening). Specifically, the transmissibility of vibration would be measured. In other words, if there was a way to measure and determine the difference between the loads that were introduced into the frame and the loads that the rider would experience, it could be determined how "comfortable" a bicycle frame was quantitatively.

Experimental Setup : From his limited test report, Dave told us that he mounted an accelerometer near the rear wheel hub which he believed would give him an idea of the loads coming into the frame. A second accelerometer positioned just below the saddle on the seatpost would get him a measure of the loads before the rider experiences them. The difference, according to him, is how much of the vibration pie the frame takes eats away.

Methodology : All four frames - Museeuw MF5, Pinarello Prince, Wilier Cento Uno and Cervelo R3SL - were tested 4 times each with 2 clincher type rims (high and low profile) and 2 tubulars (high and low). If his idea was correct, by this method, he would not see too much difference between different wheelsets since he was only looking at only the frame properties between rearstay and saddle points. The measurements were done using independent accelerometers at a measuring rate of 50 Hz. The accelerometers were synchronized before the test. This enabled him to obtain a frequency spectrum of 0 to 25 Hz at any given time after putting the datasets through a Fast Fourier Transformation (FFT). He claimed this particular test method is comparable to how construction workers are monitored for whole-body-vibrations during their work. So, for every 27-second interval, the FFT-algorithm was used to get a 2D frequency spectrum, i.e. "frequency vs. load" graph. By using the 27- second interval he could avoid any response delay of the frame when impacted. By comparing each individual 27-second frequency spectrum of the rearstay and seatpost at the same interval, he was able to construct the 3D graphs shown above which involved approximately 300 graphs put next to each other.

Results : Final results showed a margin of difference of vibration dampening less than 5%.

Interpretation Of Graph : A value of "0.8%" on the y-axis in Figs 1 and 2, according to Dave, signifies that 80 percent of the original load is being absorbed or dampened somewhere between rearstay and seatpost. So he claims that the MF-5 dampens around 70 percent of the original load whereas the Pinarello Prince in Fig 2 absorbs only 45 percent of the original load measured at the rearstay of its frame.

Now I have to commend the fact that someone in the industry is taking the first steps towards thinking about how to measure vibration. But I must admit this is a very challenging task. It would take a lot more to convince people that the above basic testing makes sense. The graphs above look colorful but is confusing to interpret in 3D. The 5% of difference from the flax can even be argued to be practically imperceptible to any rider. As of now, the testing does not account for how the vibration can be affected by the following :

1. Amount of monitoring and placement of accelerometers - Can bicycle vibration really be fully captured by just two accelerometers on the bike? And how does their specific placement and mounting affect the frequency spectrum?

2. Cushy tires and a saddle - If you let some air loose from your tires, what's the effect on vibration dampening? Tires have significant roles to play in this aspect. It is well known that racers in the grueling Paris-Roubaix lower their tire pressures to about 80-85 psi to ride on cobbles. They even bend their elbows and loosen their grips on the handlebars to a significant extent. Also, if you have a cushy seat, the force on a rider might be tiny yet the accelerations on the seatpost may be large.

3. Varying frame geometries and designs - All 4 bikes tested have different geometries and aesthetic features. What effect do that have on vibration transmission or dampening? Can you say for certain that a curvy chainstay has zero measurable effect?

4. Frame flexing - A frame design is, to some degree, known to have comfortable ride characteristics if some level of compliancy is incorporated into the design. This means that the frame can flex finitely in a particular direction to reduce shock transmission and then transfer back the potential energy by acting sort of like a spring. If the flax frame reduces vibration by flexing, this can involve high forces. So one could theoretically make a noodly little frame which is poor in power transmission but perhaps great at shock absorption. So the above study does not establish conclusively whether the claimed vibration dampening in the flax-carbon frame is infact from the vibration soaking capabilities of the flax-carbon material or because of the flexing of the frame due to the mechanical properties of the overall structure.

Infact, I did a little research on the stiffness characteristics of the MF5 flax bike to try and make sense of point number 4 above. The German Tour Magazine, an independent 3rd party testing agency for top end bicycles, tested a 56cm Museeuw MF5 a while back. This is the same bike shown in Figs 1 and 2. After some translation, here's what I believe I found :


Let's put this above table into perspective.

Early this year, the same independent magazine tested 27 top end carbon fiber bikes that you can buy for money. From the published test results, I calculated that the average torsional stiffness for those 27 bikes was on the order of 95.85 Nm/degree, the average bottom bracket stiffness was 55.77 N/mm and the average lateral stiffness of the forks of these bikes was 43.81 N/mm. So compared to those averages, the flax MF5 bike appears to be 29% lower in torsional stiffness, 21% lower in bottom bracket stiffness and 10% lower in fork lateral stiffness. This isn't sensational in the market, especially for the price of the frameset alone, a whopping 5000 dollars.

However, that's not the point. Suppose its these low numbers of stiffness that's providing all the "vibration soaking effects" in the flax frame? This can be a valid correlation, why not? Afterall, we all know that an overly stiff bike is not comfortable for long rides.

I'm eager to know more from David's side of these investigations and how this develops for the future. However, it stands right now that what he's taken upon himself is a challenging scientific task. If the outcome of these studies are minute percentage differences of one bike over the others, then someone can easily lose sight and perspective of the scale of numbers. That must be kept in mind. Meanwhile, I would encourage him and others who're on the same boat to look at the automobile industry, especially that of motorcycles and also study ISO standards on how to go about setting up experiments and measuring whole body vibration while using a vehicle.

If any of you are particularly interested in this topic, or is experienced in measuring vibration in your fields of work, please do write in to me with your thoughts here.


ADDITIONAL READING :

The Biocomposite Bicycle Part I
The Biocomposite Bicycle Part II
Whole Body Vibration According To The ISO2631 Standard
Bicycle Structural Dynamics Research

* * *

Friday, August 21, 2009

10 Safety Moment : Colliding With A Taxi At An Intersection

Jody Leonard after a car-bicycle collision

Good afternoon. Recently, a reader of my blog sent me this moving account of how he came to see the realities of a bicycle collision with an automobile.

Less than a month back, Jody Leonard who works for Deloitte & Touche LLP in Washington DC got into an accident with a taxi at an intersection. I really hope he recovers soon.

Here's a little of what he wrote to me :
"I was finishing up a training ride on a fine evening last July when I was hit by a taxi cab. I was traveling north bound on 15 ST NW toward Constitution Ave and the taxi was going south bound on 15th. This road runs in front of the Washington Monument. At the intersection of 15th and Madison, the driver made a left hand turn onto Madision, the wrong way down a one way street! I was struck by the car as I crossed the intersection at speed with the light. I don't believe he saw me at all.

So long story made short : 9 hours in the Emergency Room, cracked ribs, fractured nose, lacerations, abrasions, etc. but no head trauma as I was wearing a helmet. The driver, meanwhile, was issued a ticket by the US Park Police for an illegal left hand turn.

The Doctor estimates about 4 weeks for everything to start feeling normal again. The cab driver remained on the scene, but it was the many bystanders who came to my aid. This happened in front of the Washington Monument at the tail end of the DC rush hour and park police and EMTs were on the scene in less than 5 minutes. I was very lucky in that respect.

As for liability, in my mind the driver was clearly at fault, but accidents involving taxi cabs in the District are historically hard to deal with. So I took the advice of Bob Mionskie - former Velo News legal columnist - and hired an attorney. By the way, taxi's in DC are only required to carry the minimum amounts of insurance coverage, I really don't understand this since commercial trucks must carry at least a million dollars of insurance, and they don't ferry people around!

The worst part of all of this is my bike is toast! The pictures are deceiving since the entire frame is torqued. Both tires were blown out from the impact and my local shop tells me that the rims (Mavic Ksyrium Elites) are not bent, yet they tell me the wheels are so far out of true and tension that they cannot be salvaged. I'm wondering how this happened? So it looks like I'm out a frame and wheels, a drag since I love that wheel set!

The road back to 100% fitness has been very difficult, but I think I'm getting there. I believe it is important that people take away two messages from what happened to me. They are :

1. No matter how defensively you ride, there is always the possibility of another person's inattention and carelessness, both of which have the potential to cause great harm.

2. Always wear a helmet. I know the last causes consternation among a few who are vehemently against it, but I am certain that I would have had serious brain trauma. If it wasn't for the helmet, the crack would have been on my skull instead of the foam."

Helmet Front

Helmet Left Side Exterior

Helmet Left Side Interior

Interior Crack In Fresh Light

A torqued 7005 series Aluminum bike, much useless now


Other safety moments can be accessed here. If you have an interesting experience of your own to share, please write to me.


ADDITIONAL READING :


Deceleration And Force Of A Helmeted Head Impact

John S. Allen : Riding Through Intersections (Chapter 3 From The Online Book 'Bicycling Street Smarts')

* * *

Tuesday, August 18, 2009

26 The Machined Death Of A Water Bottle

Sometimes, peculiar things happen to us. And we like to report it. Today's peculiar story to you is a minor tragedy to me. And there's an interesting causality to it, like all events in the world around us. Let me briefly show you causality.

I had a desire to ride my Trek T1 fixed gear bike for 2 hours today. I had an appointment in the afternoon so I was in a hurry to get out of the apartment in the morning and complete the ride before then. So I donned my cycling spacesuit and filled a single Camelbak Podium with some plain orange juice, sticking it into the seatpost's water bottle cage made by Profile Design (injection molded nylon/fiberglass).

Anyway, so I head off for the ride, cruising at a good cadence on 44 x 18T gearing. The road I usually start off riding on had some construction work on one side of it today. The modest traffic was being diverted to the other. I maintained my pace but rode over two unexpected depressions in the road. I believe those people were making road bumps of some sort and I take it that they usually begin life like that - a half done, torn section across the road about 10 inches wide and 1-2 inches deep before they're filled in with a mound of asphalt (??) I faced an uncomfortable, jarring ride over those two, risking a flat. Boom, and then... boom.

20-30 minutes later, I arrive at a local park slightly out of breath and decide to sip some of that juice. Now I have grown so used to grabbing the water bottle from out of the seatpost bottle cage that I usually don't fumble much and don't give it a second thought. This time, surprisingly, my hand couldn't grab onto a bottle. Hmmm....was it still there?

I get off the saddle to check where my bottle was. Yes, the bottle was there alright, but it was a strange sight. It looked exactly like in the second picture below, reproduced for you after I returned home.


This is how I remember having placed my water bottle before heading out of home to ride.


This is how I found it in the park.


Whoa, whoa, what's going on here. How did that happen?

Let's see. If you were really observant, you'd have noticed 4 different things from the above picture. Atleast I did in the park when I got off my bike to inspect my water bottle. Yet, they are all connected. We will then tie a common thread across them and look at causality. Let's look at the picture above again.


1) The bottom of the water bottle was finely touching the rear wheel and tire. No wonder I couldn't get my hands on the bottle. Its perplexing that I rode my bike for 20-30 minutes with a bottle touching my tire.


2) There was a pronounced crack on the upper stem of the bottle cage. Hmmm?


3) One of the two fastening screws of the cage is missing. Ahhh. Okay, so now we can tie a thread across 2) and 3). It perplexes me as to how and where the screw might have popped out. I cannot answer that with certainty. It may very well have been that I started off the ride without a screw and I hardly noticed it, which is even more perplexing because I'm observant about these things.


4) And finally....holy Vitamin C! My orange juice. Its....its...gone!


Can we tie a thread across 1) and 4)?

Well, it turns out we can. Let me show you the underside of the bottle. Look closely.

The tire machined away a small section of the bottle. All the orange juice quickly escaped through it, leaving absolutely nothing in the bottle but some orange soup with road grit.


I have been trying to come to terms with how this happened. Here is a plausible theory, supported by observation :

The density of orange juice with pulp is more than that of water, about 1.2 to 1.25 g/cm^3. Because I was missing a screw in the bottle cage, the weight of the bottle stressed the plastic cage so much that it cracked the stem and compromised its holding strength. When I rode over two significant depressions in the road, the bottle slipped out of the lower base support and contacted the wheel and tire. I was riding at about 17-18mph so the tire, with a certain angular velocity determined by the gearing, started rubbing away at the bottle, producing friction and heat. Some of the juice started leaking out of the micro-hole. As the orange juice slipped out of the bottle and onto the tire, it attracted grit and sand from the road. With all those particles sticking onto the tire, the tire was now a very good abrasive. As I pedaled, oblivious to the fact that the bottle was touching the tire, the tire had become a very good machining tool and shaved away a portion of the bottle, enough to get a clearance for the tire to pass unobstructed. Finally, when I stopped to check the water bottle at the park, all the juice was gone. The grit was stuck onto the tire.

Big things happen from a combination of little things, a train of events. It is interesting to be a casual inspector and study the hows behind these events. In this case, my haphazard use of a water bottle cage cost me a nice water bottle. Now to find out how I lost that screw......


Do you have any stories to share? Write to me here.


* * *

Sunday, August 16, 2009

4 Using Computer Aided Manufacturing To Make Titanium Frames

Ever since the start of this month, Lynskey Performance Bicycles based in Chattanooga, TN has been quietly uploading videos of their manufacturing processes to the internet. As you know, Lynskey is the founder of the brand "Litespeed" which goes back a long ways. If I'm not wrong, it is now owned by another TN based company, American Bicycle Group (ABG) which makes the featherweight Ghisallo frame (weighs about 1.7 pounds). Did you know that apparently, even NASA's Jet Propulsion Lab buys tubing from ABG? I didn't want to shift topics, but something like that really speaks for the quality of titanium tubing these companies deal with.

Now in the past, I have showcased some history of the machining technology David Lynskey used in his Litespeed facility on this blog, so click here to read that article if you haven't. Today, Lynskey works with U.S. milled aerospace grade 6AL-4V and 3AL-2.5V titanium and each bike is handcrafted to customer's needs using some special technology.

After some interesting hunting, I learnt that two new Mazak machining centers (CNC milling machines) were installed at the Lynskey facility. One is a Quick Turn Nexus 200-II and the other is a Vertical Center Nexus 510C-II. These babies are "the Cadillacs of CNC machines". These options will give them design and manufacturing flexibility, productivity and time savings.

In the following sample video, we can see the 5-axis tool path in creating a fork dropout and a headtube badge. This is actually created in CAD/CAM which generates the NC machine code, which is then fed to the Mazak machine via Ethernet cable. The machine now knows "what to machine" and "how to machine" it. This is one episode in a series of videos called "How We Make A Lynskey". I encourage Lynskey to go ahead and keep showing normal customers what role these machines and tools play in the big scheme of things. There is great value in not only purchasing and riding a certain variety of bikes but also learning how they're made.


ADDITIONAL RESOURCES :

Technology Helps Bike Builder Pick Up Speed
CAD/CAM Basics
Introduction To Machining
Ch 20 : Machine Controls from Tool And Manufacturing Engineer's Handbook
CAD/CAM Process Planning : A PDF Presentation from MIT
Can A Titanium Frame Be Reused After Fire Abuse? An Analysis

* * *

Thursday, August 13, 2009

4 How To Form Excuses On Horrible Climbing Shows

So your riding buddies trash talked you into riding some monstrous hills out somewhere in the exterior of civilization. But you've felt better on other occasions and boy oh boy, today is just not your day. If only bicycles were made like computers, we could all have an escape key before the bone breaking, lung chopping climb to hell. But there are no shortcuts to escape.

Hit hard...

So how on earth do you back up and slow down like a rock efficiently on the incline without hurting valuable pride and self-esteem in front of other people?

This, it turns out, is an easy one. Let me show you The Way.

Things you will need to carry in your jersey pocket :
  • -Pair of scissors.
  • -Wife's makeup. If you're a wife, then borrow your husband's makeup. Look in the garage.
  • -Cell phone.
Things you will need to carry on your back :
  • -A camelbak filled to the gills with water. (If it does not have gills, make sure you purchase one with gills)
As your attackers, a.k.a riding mates, slam down the pressure and leave you climbing slowly like an unattended VW Beetle, cleverly start launching the escape tactics. You may do any of the following or all for a combination excuse strategy (like those 2-D video game "COMBO" attacks)

1. Cell Phone : Quickly reach out to your cell phone and start calling people you never knew. Old uncles, old distance-relatives or grandparents are usually the best. They ramble on and on and on without direction and it won't matter much if you hang up on them. They'll never remember. Ask them questions about life and wisdom and pretend you're in serious conversation with the sage. Exaggerate your voice and follow your attacker's reactions. They'll turn back and look at you. Then they'll mumble amongst themselves in the distance, nodding their heads and acknowledging the fact that you're making a few business calls and that takes priority over climbing some stupid hills.

2. Makeup : Quickly reach out to the makeup box while your attackers aren't looking.
  • -Take a shade of gray or something and start coloring your hair on the sides. Use a helmet mirror for assistance. When your attackers look behind, they'll see an old, worn out friend struggling up a hill. But sympathy will usually turn to respect and disbelief. It is an unwritten code in cyclysm to encourage and respect an old dog who can climb.
  • -Take a shade of yellow and start coloring your face. When your pace is exactly below 4 mph and you risk looking like a dork on wheels, yell out that you may be coming down with a bout of Dengue Fever and you need to climb slower for it to go away. Pretend you're rubbing the disease away.
3. Scissors : So you're climbing like a dork today but you're showing off a kit that says 'Winner Of So and So Race' or 'Champion Of Ridiculous Time Trial In Town' or something along those lines. Kits musn't be shamed with bad performances from the wearer. It is a hurt to pride.

Quickly reach out for the pair of scissors. When your attackers aren't looking, snip away cool looking sponsor logos, titles, past honors etc etc...then form them into a ball and throw them into the bushes in the side. Make sure they roll off and away from sight. When your attackers look at you and spot your disheveled state, tell them you had a wipeout. "The front wheel shimmied!" They'll quickly slow down and come to your rescue. If they don't (jerks), they'll ackowledge that you need to climb more slowly because of this 'crash' they didn't see. Slow climbing performances will then be accepted without question. Onward.

4. Camelbak : Hydration forms the core of excuse making. Now don't get me wrong. This is not a hydration to quench thirst. It is a hydration to excuse forming. When the climb is about 5 or 10 miles away, quickly start slurping in all the water you can find from the hydration bag. Get to the front of your attackers. Then get off your bike and take a long pee. Start making a few whistles. Put on a grimace to show that its getting tight down there. Stay in that position for 3-5 minutes.

Your attackers will notice this and acknowledge that you slowed down naturally to take a difficult leak. You're not going to climb as fast as them. Atleast not today. They'll wait on the top of the hill for you.

Now that was easy.

But please be reminded that none of the above strategies will work if you see a road sign beside the official start of the climb that looks like this :


To your dismay, the advantage is now on the attackers' side. You either let the inevitable happen, or you slip out of your house in the black of night, drive your car to the climb, dig the sign out with a shovel and a flashlight and hurl it down a big cliff. Wear thick black leather gloves when you do this.


* * *

Monday, August 10, 2009

4 Kinematics of Bicycle Hub Internal Transmissions


An internal bicycle hub is an intricate planetary gear mechanism and is made of dozens of small parts. See, long before the derailleur became a staple in racing bikes in the 20th century, internal hub gears ruled the roost. In those days, these beautiful devices offered the first practical ways to shift gears on the fly. What a godsend!


In order to fully understand this beautiful system from a technical standpoint, we need to study the kinematics. or motion of the gearing action.

Click to zoom up the following one page article which explores the dynamics of the gearing in a 3 speed Sturmey Archer planetary gear hub. It explains how "gear ratios" are obtained in a planetary hub system by following some simple 'rolling contact' principles of gear motion. I borrowed it from my one of my favorite engineering textbooks. I hope this will make you appreciate the science behind bicycle transmissions. Also, when you get a chance, open up a hub and check it out for yourself!


* * *

Saturday, August 01, 2009

27 The Rate Of Climbing Uphill Explained

I've noticed that some cyclists who have been introduced to the concept of the rate of climbing uphill falsely think that Michele Ferrari pulled this out of his own pocket, as in, he invented it or something of that nature. Negative. He only went ahead and popularized the idea, putting a confusing trademark name to it such as "VAM" and developing some of his own methods to look at it with respect to cycling performance. But the idea itself is rooted in centuries old elementary geometry and Newtonian physics. Click here for the history of vectors.


Let's have some *serious* fun with climbing rate. You'll start to see simple relationships that may finally make some sense to you as a cyclist. If you love analysis, this may be for you.

I'll show 5 different ways to study vertical speed, or rate of climbing. 3 of them are using math. The 4th involves using some field work with math. I'll show you what Tom Danielson's climbing rate was for the record ascent up Mount Washington and I'll also show you an error analysis done on it with an example, which is pretty important on anyone's estimations. Finally, the 5th method shows how using some devices do this all for you instead of number crunching.

Let's begin. Enjoy over a cup of tea. If you see something fishy, I welcome you to call out any errors in the proceedings.


METHOD I - A Power Perspective

The overwhelming portion of total propulsion power in Watts needed to just climb uphill on a bicycle is given by the following relation :


9.81 = acceleration due to gravity on earth's surface (meters per second squared)
M = total mass of a bicycle and rider (kilograms)
Vg= ground speed (meters per second).
G = grade of hill, expressed as a fraction = (Rise/Run). To see a graphic of what rise and run mean, click here.

This is only power for climbing and does not include power to overcome wind and rolling resistance, drive-train losses or power for acceleration.

Note 1 : For steep grades, instead of simply (Rise/Run), G should be replaced with :


To put into perspective, at a steady 10% gradient, error % between the small angle approximation of (Rise/Run) and the real formula above is about 0.5%. At a steep 20% grade, it is 1.9%. At a near to impossible 30% grade, it is 4.2%. At a vertical asphalt of 45% grade, the error is way off at 9%.


Rate Of Climbing Broken Down

Now if I were to take the above power equation and break it down into 2 little packages, here is what each package would mean in a practical sense.


In other words, power equals the product of a force (total weight acting downwards) and vertical speed, which in other words is the rate at which you cover vertical distance.

Let's take the second package, the climbing rate.

This is it. Its a beautiful equation. Its units are in meter/second and you can convert it to meter/hour. 1 meter/second = 3600 meters/hours. Its also called VAM by Ferrari, which may be a pretty confusing term to people.


Practical And Theoretical Limits Of Climbing Rate

The equation for climbing rate, with G substituted, is :


If we chuck out the sine function using an overhead crane and plot it, it looks like the following :

Fig 1 : The Climbing Rate Curve for a ground speed of 1 m/s. Cyclists climbing on human power alone can only use a tiny portion of this curve above y=0, ranging from 0% grade to 40-45% grade.


In the linear yellow region, any point on the curve can be given by the equation (rise/run) with negligible error. I have chosen about 10-12% for the upper limit of the linear portion. For any hill grade above this, its better to represent G in the power equation with "Vg.sin[arctan(rise/run)]" than just "Vg.(rise/run)" to avoid errors.

Also notice the point on the curve that signifies 45 % gradient. It is impossible to ride efficiently above 40%. After 45% is the curve signifying landslide possibility, which cannot be attempted by any cyclist. This is the upper limit for practical climbing rate.

Observe the upper and lower limits of the curve in blue. They are called asymptotes because the curve tends to approach towards them but never reaches -1 or +1.

The effect of the ground speed term Vg (other than 1m/s), when multiplied to this sine function f(x) will be to stretch out f(x) like a rubber band and extend the upper and lower limits of the asymptote to -Vg and +Vg. What this is telling us is that if a cyclist's ground speed is, say, 5 m/s (11.2 mph, 18 kph), his climbing rate cannot go below -5 m/s (-18,000 m/hour) or above +5m/s (18,000 m/hour). These are the absolute upper limits of theoretical climbing rate for his given ground speed of 5m/s. Its the heaven and hell of climbing. Both are impossible. (Whether hell is above or below is upto you to decide. I think in climbing, hell should be above!)

Note 2 : If grade kept increasing and increasing, do you think gravity will actually allow you to keep climbing on your own power? In other words, would rate of climbing keep on increasing with step increases in % gradient, as Ferrari's website may have you believe? Yes, it does. But there's a limit where we can't go further and vertical speed drops to zero. As you ascend uphill your muscles have to supply the power to increase your potential energy. It doesn't come from thin air. Eventually, you will become tired. Your mechanical gearing advantage will decrease as you have a finite set of gears. Your speed will decrease exponentially and at some critically steep grade possibly 40% or more, your velocity will be reduced to near zero and you can roll backwards or fall. It doesn't become efficient to propel yourself anymore. See Fig 2 below. This is why I argued in the past that on very steep grades, it is more practical energy wise to get off your bike and walk. Why? Because the speeds are more or less the same cycling or walking!

Note 3 : Human muscular power is also very different from electrical motor power. The capability of a human to deliver bicycle propulsion is a function of time before becoming exhausted, also called endurance time represented by the symbol tau (T). Every individual has a power curve (Watts vs Time) that generally curves downwards from left to right. It tells us that high power can be sustained for lesser time than lower (but slower) power output. It is very unlikely that a high climbing rate can be sustained for a very long time through human power alone (unless you're some freak). This can be seen in the graph below.

Fig 2 : Pick a certain W/lb and while staying on the horizontal line, notice how your ground velocity Vg decreases drastically as you move towards the sloping lines representing higher grades.


Relationship Of Climbing Rate To Grade Inside And Outside Linear Curve

In the linear portion of Fig 1, a 10% relative increase in grade in the linear region (say from 7% to 7.7%) should theoretically result in a 10% increase in climbing rate. In other words, climbing rate is directly proportional to the vertical ascent and inversely proportional to the horizontal length of climb. So if we kept ground speed and run constant, a higher rise leads to higher climbing rate and vice versa. Say we doubled the ascent, then climbing rate is double the initial rate. Conversely, if we kept ground speed and rise constant, a longer length of climb will decrease climbing rate or vice versa. Say we doubled the length of the climb, then the climbing rate is halved from the initial rate. If we halved the length, the rate is doubled.

Outside of this linear curve after about 10% gradient, a 10% relative increase in grade (say from 17% to 18.8%) should only result in a 3.8% increase in climbing rate. So even though climbing rate increases, it doesn't increase as much due to the nature of the curve above. You can see how its trying to level off.


An Example : Andorre Arcalis 10.6 km, avg. 7.1 %, catégorie HC

We can take the profile information of the ascent to the ski resort of Arcalis and compute our climbing gradient for each kilometer using kilometer specific gradient and kilometer specific ground speed. The grade isn't steep, hence you can use G = (rise/run).

Do this for all 10.6 kms, add them up and take their average. You should end up with an approximation of your total climbing rate for the mountain. Here is first example done for Kilometer 1 :

Fig 3 : Km by Km Calculation Of Climbing Rate. Click to zoom in.


METHOD II - A Geometric/Vector Perspective

If you remember some vector theory, you know that any vector can be resolved into component vectors. In our 3-D world, the velocity vector of a cyclist uphill can be resolved into an x-component, y-component and z-component velocities. For the sake of simplicity, if we looked at it in 2-D, it would look like the following. The upward velocity component is the climbing rate or vertical speed. Refer to the equations on the right side to solve for these Cartesian component vectors.

Fig 4 : Resolving Ground Speed. Click to zoom in.

Try to visualize this picture of blue, red and green arrows in your mind as you imagine the cycling moving uphill. The length of each vector signifies the magnitude of the speed. As the cyclist changes speed or accelerates, the length of the ground velocity vector changes in real-time and so will its components since they're all connected. Once the cyclist approaches the downhill section over the other side, the direction of ground velocity vector points downward and its length increases because of the action of gravity and the quickening of pace (until terminal velocity is reached or above). The vertical component will then point directly down and its length signifies the descending rate.

Note 4 : In the real world, since we have a third vector for the lateral swaying/zigzagging motion as you climb a hill, the climbing rate calculated from 2-D resolution of vectors would be some percentage off from the real value. This is the error resulting from simplification.


METHOD III - A Time Perspective

Suppose you don't care for any of the above nonsense to calculate your climbing rate, you can still find it out using your time. Go out to a climb like Mt. Washington in the United States and time yourself using a stopwatch. For example, back in 2002, Tom Danielson set an unbeaten record of 49'24" for the 1432m ascent at 11.9% ave.


Plug in what we know for Mt. Washington. Ascent = 1432 height meters. Climb time = 49.4 minutes.

Tom's VAM estimate from time comes out to 1739 meters / hour. If you want to break his record, you need to aim for round about this vertical speed. Else... you can sit at home and eat ice cream.


Climbing Rate Error Analysis

Now we all are human beings. Our stop watches are not very precise instruments. And when someone tells you that the ascent in meters of a mountain is "x", what is the error in it and how does it propagate into the final climbing rate calculation based on Method III?

Well, that is simple. Here the error equation :

where :

δClimbing Rate = Error in climbing rate (meters/hour)
δAscent = Error in ascent (meters)
δTime = Error in time measurement on a device.

Lets put this into perspective. Lets just suppose that the person who measured Tom Danielson's climbing rate was 50 meters off in his estimate of the total vertical climb and there was a time measurement uncertainty of 0.2 seconds or .003 minutes (20% of least count of a watch of 1 sec is a good rule of thumb). If we plug this into the error equation, we get :


What this is telling us is that because of the uncertainties in the vertical rise of the climb and time taken in our example, the uncertainty in Danielson's climbing rate (or VAM) is 103.8 m/hour. The relative error is then a 6% error in the initially calculated figure of 1739 m/hour.

This is just an example, mind you. I did not declare that someone estimated the ascent 50 meters off the real value. Yet, this shows that its important to do an error analysis on anyone's climbing rate measured out on the field. Michele Ferrari does not show an error analysis on his data presented on his website concerning this year's Tour de France. People are bound to look at inflated values and declare, "HE DOPED, HE DOPED!! CATCH HIM!"


METHOD IV. An Analytic Perspective

If you still want to dig deeper into some relations using the power of partial differential equations, see Dan Connelly's page on an analytic treatment of climbing rate. You get more mathematical ideas and can do more cool things with it. Dan is a semiconductor engineer from California and like all engineers, loves his number crunching.


METHOD V - A Device Perspective

If you think math and science are beyond you, then spare some coin and try a nifty little device called a variometer, or vario for short. Paragliders use wrist-mounted variometers to check their vertical speed and altitude. This is an expensive but lightweight gear. It uses electronic pressure sensors to sense the change in pressure around them. Since there is a correlation between pressure and altitude, it is possible to calculate instantaneous rate of ascent or descent. For example, between the foot and the peak of the Arcalis climb, there is approximately 0.08 kg/cm2 of pressure difference.

The one shown in the picture, made by a company called Ascent, displays vertical speed with adjustable averaging (m/s or ft/min). Its resolution is 0.1 meters/s or 360 meters/hour. It can record data for 200 'flights' and has a rechargeable lithium-polymer battery with life of upto 10 hours or 4 hours standby time. Because a cyclist's vertical speed range is so small in comparison to a paraglider (the speed range of a paraglider is typically 20,000–60,000 metres per hour), such a device may even be impractical. Here's a video of how it works. I have not used one so it'll be interesting to find out whether they work in any useful manner for a cyclist.

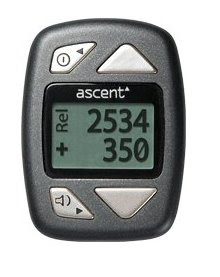
Fig 5 : Ascent Vario, $250-300


Another option is the Avocet Vertech II Alpin which is built for mountain hikers. It is claimed it can show you current climbing rate of range 0 to 28,000 feet per hour in with 100 ft/hour resolution or 30 meters/hr. See other features here.

Fig 6 : Avocet Vertech II Alpin, $250


A reader also commented that Mavic's Wintec Ultimate cyclocomputer that costs about $200 can also show you vertical climbing rate, but I cannot confirm this.


ADDITIONAL RESOURCES :


Power To Weight Ratio
Air Pressure And Altitude Above Sea Level Reference Table
The Standard Rule For Climbing Bragging Rights
Contador's Climbing Rate & Power to Weight Ratio on L'Alto de Angliru (Spain)
Error Propagation


* * *